


Optimising Your Data Stack
In this article we will go over each element of a modern data stack and recap what the layer does, important considerations for each layer and provide some suggested tools. Those suggestions are based on today’s analytics ecosystem. (Analytics is an extremely fast-paced sector so it is always worth looking out for potential new solutions)
The Extraction Layer
What is it?
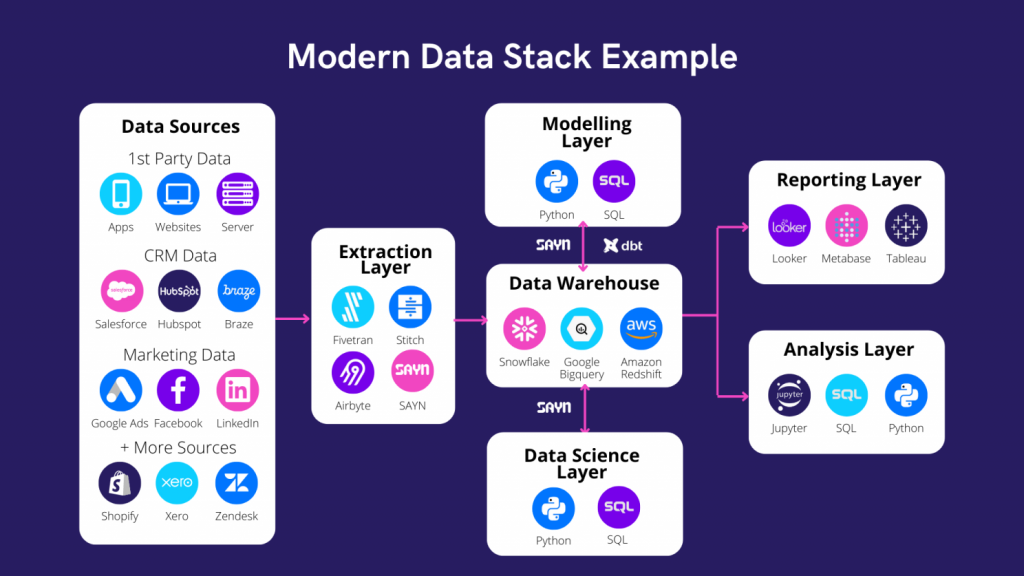
The “Extraction Layer” consists of automated processes to extract data from your various sources such as app & website events, replica databases, digital marketing platforms, etc. and load them into a data warehouse such as Snowflake, Redshift, BigQuery etc.
What matters?
For this layer, the key is to assess the trade-offs between flexibility and automation. When getting started with analytics, you want your team to spend as little time as possible on extracting and maintaining data processes.
There are several tools available to automate data extraction. Those simply help you to move data from various services into your data warehouse without writing a line of code. It is worth investigating those to save data engineering resources within your team.
However, make sure that whichever tool you choose (if any) for this stage extracts and loads the data in an efficient way based on how you need to extract data. Extractors can sometimes be built in a one-size-fits-all way which might force you to make inefficient transformation with SQL after the data has been loaded. In such cases, a custom Python extract would be best – you can use SAYN (our open source data processing framework tuned for simplicity and flexibility) for this.
Potential Tools?
Fivetran, Alooma (if you are on the Google Cloud Platform ecosystem) and Stitch for off-the-shelves providers. SAYN for custom Python extractors.
The Modelling Layer
What is it?
The “Modelling Layer” consists of automated transformation processes that organise the data in your data warehouse so it is easily consumed by reporting tools or analysts.
What matters?
First and foremost, make sure you have a modelling layer. Not having one will create extremely inefficient and messy processes down the line. This will hinder data accuracy and increase the time spent by analysts and data scientists on data processing.
Modelling is however one of the more time consuming and complex tasks into data manipulation.
Modelling creates a single “source of truth”. Because all your analytics and reporting tools will end up using the same pre-processed “models” (i.e. data based on standardised and documented definitions).
Modelling is, in essence, a set of tasks (e.g. SQL queries) running in a specific order to create tables or views (i.e. “models”) that can be directly consumed by reporting tools or analysts and data scientists. Because there is a specific order, you want to be able to define relationships between tasks (i.e. which jobs need to be run before job X is processed).
For example, if your team ends up writing SQL queries to calculate retention often, you could create a model that stores the retention status of each user. In that way, analysts can directly read the retention model to calculate retention instead of re-writing the query themselves.
Potential Tools?
We recommend using a solution that lets you orchestrate tasks with both SQL and Python. Keep in mind that flexibility is key to long-term scalability. Even if you use an automated extraction tool in your extraction layer, it is quite likely you will need some non-SQL processes (e.g. Python) in order to extract data for which no extractor is provided or for data science. Our open source data processing and modelling framework called SAYN is perfect for that!
The Reporting Layer
What is it?
The reporting layer consists of a reporting tool that sits on top of your data models and enables non technical users to visualise and digest the data. This covers all the dashboards created for business users in order to automate insights.
What matters?
Reporting is the front-end of your analytics team. This is what all business users see and use every day. Make sure reporting is accurate and easily digestible, otherwise you will seriously hinder the trust in data and analytics within your organisation.
Use a tool which has a simple user interface and makes data easy to consume for business users. Having a drag-and-drop option is a powerful feature as this means any user can build their own dashboards. This also means you do not need to write SQL for every visualisation (and re-write SQL when you need to make modifications!).
One of the key purposes of reporting is to automate repeated data requests and release analytics resources so your team can really spend time finding insights and generating business value.
Ensure your reporting tool has a level of logical model (i.e. it enables you to define some metrics based on your underlying data). However, make sure that all your heavy data processing is done in the modelling layer, you want to avoid having business logic living in different places.
Ensure the tool has an efficient workflow. You want making changes to be easy and not error prone. Again, reliability is key for reporting, you need to minimise downtime.
Potential Tools?
Looker, Metabase (free and a good option to get started), Tableau, Power BI.
The Analysis Layer
What is it?
The “Analysis Layer” is a workflow for analysts to do in-depth analyses of the data. This layer is different than the reporting layer in the sense that it is used to investigate specific topics in much greater detail than you would do with dashboards. If you end up repeating an analysis frequently, it should then be moved to the reporting layer with an automated dashboard.
What matters?
For this layer, you need an easy workflow for your analysts to explore data and present insights. Jupyter notebooks are a good option, they are widely used and have kernels for many programming languages.
Using a programming language and notebooks over Excel also has many other advantages. It brings transparency to data processing, enables automated re-runs (as you only need to change the underlying dataset) on top of allowing you to handle larger datasets as well as leveraging all the programming languages’ modules.
Have a process to make the reports easily shareable across the organisation. You may consider using JupyterHub or hosting on a web portal the output of Jupyter notebooks (which supports export of various formats).
Potential Tools?
Jupyter Notebooks, JupyterHub.
The Data Science Layer
What is it?
The “Data Science Layer” is a collection of models and algorithms predicting user behaviours and running on production. Those can be refreshed at any desired frequency with results embedded into other systems for optimisation purposes. The data science layer should be entered once you have a robust structure on all other layers.
What matters?
Implementing data science models on production is a really broad topic and depends on your overall architecture, so we will not get into details in this post.
For the exploration phase (i.e. building the model), this can be done through the “Analysis Layer” using Jupyter notebooks where your data scientists explore various solutions and optimise model performance.
Creating API endpoints for your data science models to power other parts of your business (e.g. customised user experience, optimised marketing spend, tailored CRM flow, etc.) is often a good solution to begin with.
Potential Tools?
Jupyter notebooks for exploration and Flask applications in order to make model predictions available to other services.
Bringing The Layers To Life
In order to get the most out of your analytics, all of the above layers need to be optimised!
We know things can sometimes get tricky when it comes to the implementation stage, especially if you are getting started with analytics. We are always happy to chat and see how we could help, so don’t hesitate to get in touch!