


Maximise Data ROI with the S.C.A.L.E principle
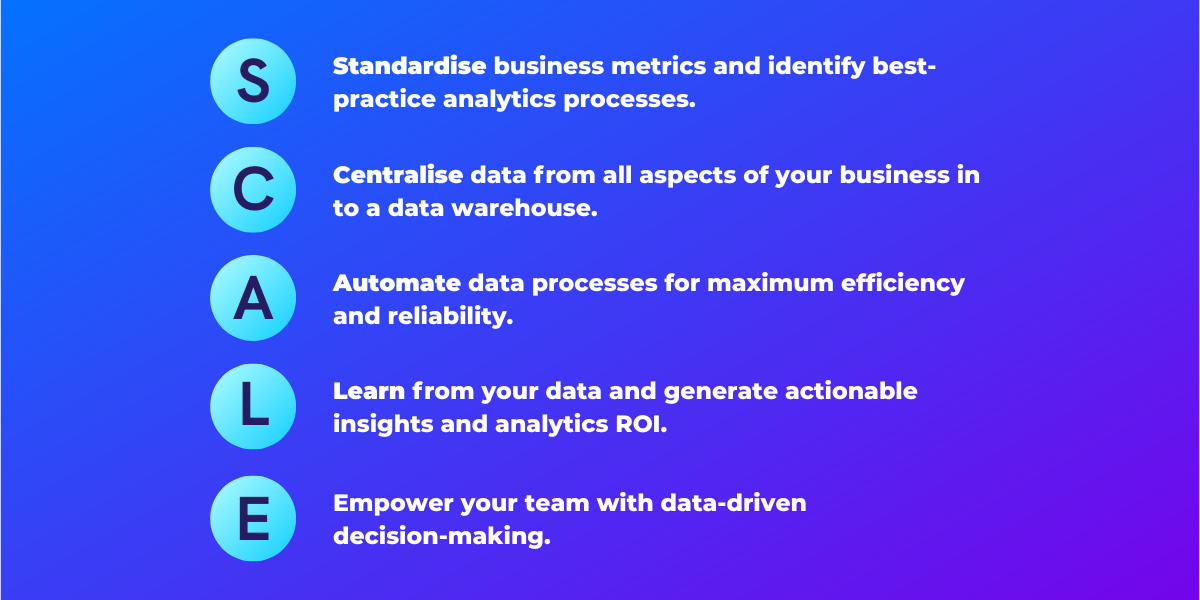
How do you make the most out of your data? How do you ensure that your investment into infrastructure and analysis pays off? We work with a lot of fast-growing companies who realise they need to harness the power of data, but aren’t sure where to start, that’s why we came up with the S.C.A.L.E principle. It’s a simple, step-by-step guide as to how to start and what’s important as you grow.
Standardise
The first step towards a world-class analytics stack is to standardise business metrics and apply best practices over your entire analytics processes.
To get the ball rolling, we will start with a data dictionary. You can think of this as a glossary of terms, where you are defining your key business metrics, what they mean and how they are calculated and also where that data point sits. This lays out exactly what your one source of truth is for each of those metrics. Take monthly revenue for example, it is an important metric with many caveats. Does it include taxes, refunds, or deferred revenue? A consistent data vocabulary allows for clearer communications and goal setting between different teams.
A data dictionary should start off with your core KPIs and business terms and grow and evolve alongside your analytics stack. Adding technical definitions to each item in your data dictionary will help to bridge the gap between business and data. It also provides the technical translation for the automation step later.
Your data dictionary then acts as a guide for implementation. Setting up a data stack may seem like a daunting task with so many different vendors out there and different technologies but it can easily be broken down into smaller questions.
Data sources. List all of your data sources. Identify which ones are the most important or have the most pertinent information.
Extraction / Loading. You then need a way to get this information and transfer it into your warehouse. Your data sources and the information you need to carry across will inform the decision on this tool. It might be that you can use a provider like Fivetran, or you may need to create a custom connector.
Data Warehouse. The data warehouse is where this information is stored and transformed. The key considerations here are: how much data you will be handling and how frequently you will need to process and access the data.
Visualisation/Reporting. With your data modelled, you will need a way to surface insights. Key considerations here are who are the end users, how many are there and who will be creating and maintaining reports.
Growth. The last factor to consider with any data stack is that your needs are likely to grow. It can be difficult to estimate how much more data you will be handling in the future as you acquire more customers or add more data sources. We generally recommend technology providers with a linear or growth-friendly pricing model without a sharp price increase beyond a certain level of usage.
If you want to find out more about the components of a modern data stack, check out our other article here, and if you need advice on what elements should go into yours, feel free to ask.
With the data stack selected, you need to formalise your implementation processes covering requirements gathering, prioritisation, development, peer review, production release and rollout.
Centralise
With your data stack set-up, it’s time for all your data sources come together. Data from all customer touchpoints (marketing, sales, customer support, CRM, fulfilment, costs etc.) should be gathered in one centralised location whilst retaining all the information you care about.
The key here is to select the right tools for your data infrastructure for optimum performance and scalability. For your data warehouse, some options include Snowflake, Redshift or BigQuery, depending on your existing tech ecosystem and intended usage. If you have large volumes of data, you might also want to have a data lake to store raw data, using tools like Hadoop or Amazon S3 buckets.
Another important aspect of centralisation is your code base and reporting. Ideally, all your analytics scripts (e.g. SQL, Python tasks) should be easily accessible from one location. We also recommend a single visualisation platform for all your reporting dashboards to avoid disjointed insights.
Automate
Once you have defined the data sources to collate and their destination, you should consider automating the following aspects of your pipeline:
- Data extraction
- Data modelling
- Data visualisation
Data extraction ensures that information is delivered consistently from all sources at your desired time interval. Some tool options include Stitch or Fivetran. Consider it your delivery guy who picks up the data package every morning and deposits it into your data warehouse.
For all the data packages arriving in your data warehouse, perform data modelling for two key purposes:
- Ensure all sources are linked via unique identifiers to create your own single customer view.
- Apply the business logic defined in your data dictionary and transform raw data into meaningful KPIs.
Once created, you can utilise the data models to create dashboards that clearly visualise your KPIs. Best practice is to have a top-level dashboard that summarises key trends and quickly unveils opportunities or issues in your business. Then design a dashboard per business vertical (e.g. marketing performance dashboard, finance P&L dashboard etc). Metabase, a free tool, is a good option as you start your data journey. As your team and data capabilities scale, consider moving to a more robust solution such as Looker.
Learn
Now with your own centralised data gold mine, you can start learning from it.
With an efficient data pipeline, you can train data science models to segment, predict and influence customer behaviours. Customer lifetime value (CLTV) predictions, churn propensity scores, recommender systems, automated consumer sentiment with natural language processing (NLP), your power here is unlimited.
These models can be integrated into other parts of your products and services to create unique competitive advantages. It creates a constant and dynamic learning loop from observing user patterns, creating algorithms, feeding it into your product development and observing new feature usage.
Another element of the learning loop is user testing. To encourage a desired behaviour on your app, your team came up with a number of ideas. How do you know which one will be the most effective? Run an experiment and test these options against a control group. Test results should be modelled, automated, and visualised in a dedicated testing dashboard. This will allow you to capitalise on the winning variant early and stop any poor performing test promptly.
Make sure you have a process where all learnings feed into your internal knowledge base and are shared across all teams.
Empower
Last, but in no way least, you need to ensure that your team can read, understand and act upon data.
For your data science and analytics team, data efficiency and reliability ensure little time is wasted on digging and cleansing data. Instead, they can focus on mining deep product and behavioural insights, and building state-of-the-art algorithms.
For product and marketing teams, a well-structured data warehouse and user-friendly visualisation tool enable everyone to create ad-hoc reporting tailored to their changing needs. It provides timely feedback on current projects and efforts, so one can pivot and adapt quickly as new data insights stream in.
We recommend that the best way to start embedding a data-driven culture is by having ‘data champions’ within different functions. These are individuals who are passionate about using data effectively and who promote data best-practice. They don’t need to be technical people, just people who can ensure your individual teams are using data in the right way. We will provide extended training above and beyond the basics with how to read, interpret and act on data.
How Can 173Tech Help?
Last, but in no way least, you need to ensure that your team can read, understand and act upon data.
For your data science and analytics team, data efficiency and reliability ensure little time is wasted on digging and cleansing data. Instead, they can focus on mining deep product and behavioural insights, and building state-of-the-art algorithms.
For product and marketing teams, a well-structured data warehouse and user-friendly visualisation tool enable everyone to create ad-hoc reporting tailored to their changing needs. It provides timely feedback on current projects and efforts, so one can pivot and adapt quickly as new data insights stream in.
We recommend that the best way to start embedding a data-driven culture is by having ‘data champions’ within different functions. These are individuals who are passionate about using data effectively and who promote data best-practice. They don’t need to be technical people, just people who can ensure your individual teams are using data in the right way. We will provide extended training above and beyond the basics with how to read, interpret and act on data.