


Accelerating Growth With Analytics: User Activation
Once you get users through the door (or onto the app or website), you want them to make certain actions so they move on to the next level of their user journey. For example, an online publisher would encourage visitors to register an account and ultimately become paid subscribers.
Activation in the Broader Sense
‘Activation’ covers wider activity than the first conversion. You may consider it as any action that moves users further along their journeys to become long-term valuable customers. It can be as trivial as opening a push message or as significant as purchasing a house. The key here is to maximise the percentage of users taking a certain action.
Event Tracking
Analysing the steps before the action can help you identify drop-off points and improve overall conversion rate. For example, there might be a sub-flow without a cancel or back button where users are ‘stuck’; or a certain page might contain confusing description of your product where users keep revisiting and jump to the help page next; or there might be a prompt introduced by a different flow that is interrupting the current conversion.
This is where event tracking comes into the picture. It records the steps of individual user behaviour: visit a page, click on a button, select from a dropdown menu etc. It can be designed to track a rich set of properties with each event such as device type, device language, app version etc. It enables the breakdown and comparison of event flows by various dimensions and helps identify issues such as caused by a specific app release or a misconfiguration on iOS in a timely manner.
Onboarding Flow
An optimised on-boarding flow is a good way to guide users through your product and encourage them to take further actions. It is likely one of the many important flows you have, e.g. payment flow, subscription flow etc. We will use Calm’s on-boarding steps as an example to demonstrate the potentials of event tracking.
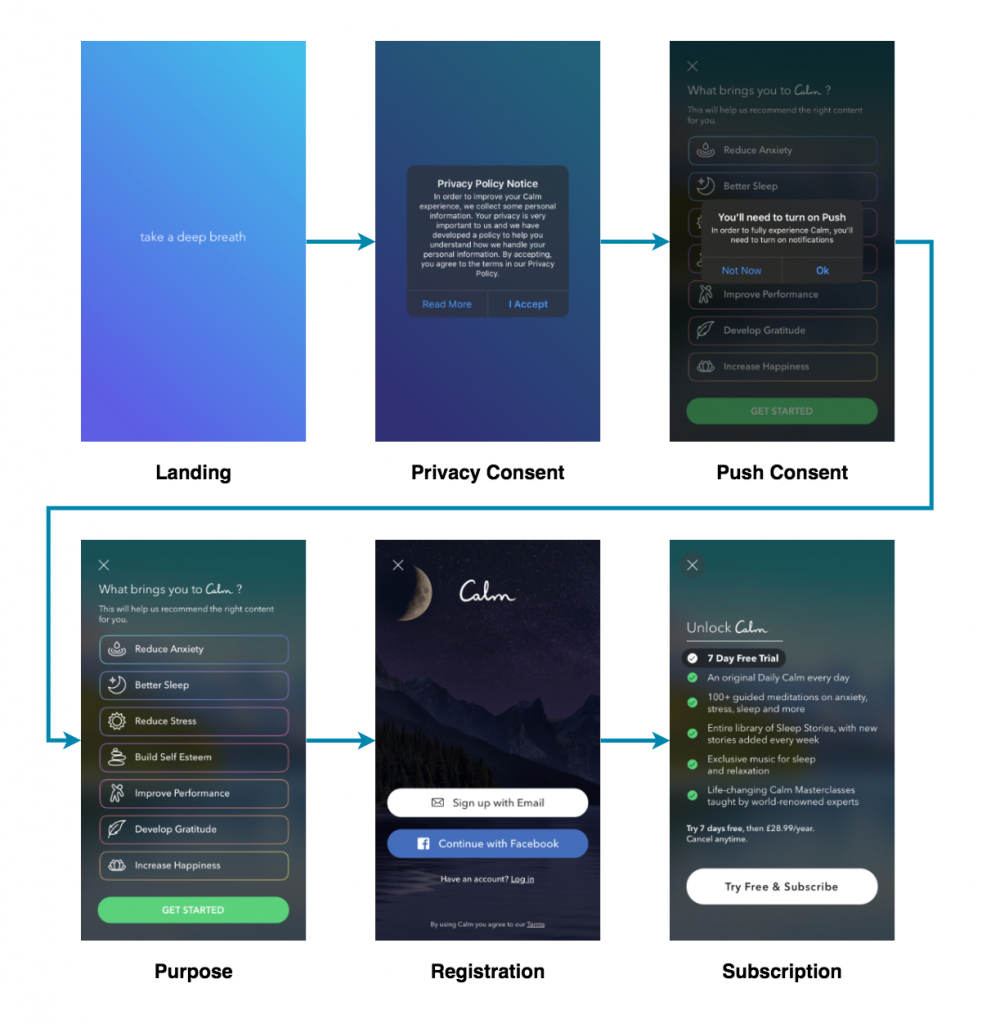
Assume you have just designed and released the above on-boarding flow. At each step we collect user events on page views and button clicks, each with its own set of contexts. Below we aggregated 7-day worth of event data. Please note, the figures are made up purely for the purpose of this post.
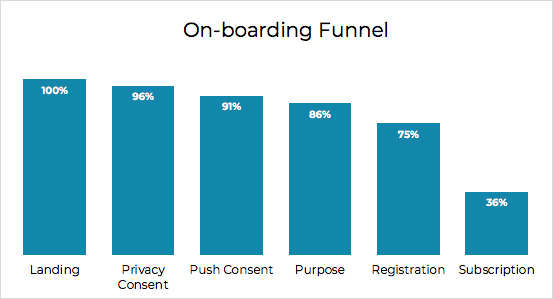
You can also breakdown and compare the funnel based on different context you collected. For example, are Android users converting better than iOS? Or maybe there is a problem with localisation, e.g. the Spanish copy of this flow is performing worse in Mexico compared to others.
From the above visualisation, it is easy to spot the main drop-off step: Registration => Subscription. The next step is to zoom in around these two points. The Sankey diagram below provides a nice overview of how users travel through the on-boarding journey. You can also build this view as an animation over time, which shows the evolution of on-boarding performances.
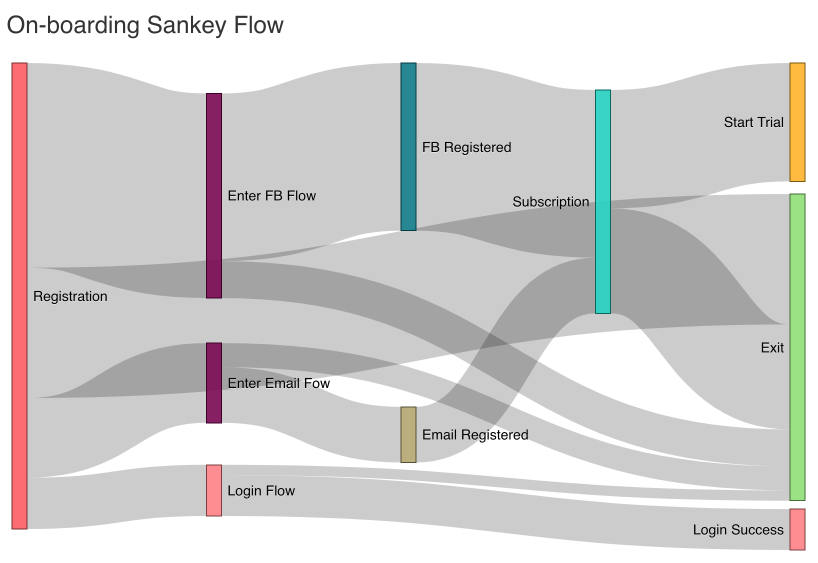
The above Sankey flow shows a large proportion of users are dropping directly after the registration page. You will then want to debug further with other data dimensions, i.e. new vs. existing users. Is the login button too small for existing users perhaps? Or by the next action, are users distracted or concerned by the Terms page? With some data-supported hypothesis, you can create alternative designs and perform split tests. We will discuss A/B test in the next section.
Other food for thought on Calm on-boarding mock figures:
- 25% of users exited before Registration step, almost half of which happened at Purpose step. It is worth testing moving this page after the registration funnel and different copies of this page.
- Both Facebook and Email registration flow has a sizeable drop-off, 18% and 30% respectively. Next step is to drill down to each sub flow and optimise accordingly.
- 53% of users started the free trial from the Subscription page. Room to improve? This page is a good candidate for Multi-armed Bandit experiments, which we will discuss more next.
A/B Test
To optimise conversion at each point, your team will have many exciting ideas ranging from copies to designs to promotions to default options and more. How do you judge if an idea will be successful? A/B test or split test is a statistically-robust way to conduct an experiment on a subset of your users, validate the results before releasing it to the mass.
Typically you will have a randomised group of users that receive the original version, aka the control group, and one or more randomised test groups that each receives one version of changes. The test will run for a set period of time according to your internal best practices, e.g. reaching required sample size given baseline conversion, expected uplift and significance level. We will spend more time on A/B test in a separate post as this is probably THE most important tool for continuous product development.
Testing on Steroids
Traditional A/B test follows an explore-then-exploit model, i.e. you explore the potential effect on a proportion of users first then release and ‘exploit’ the rewards on everyone after. Multi-armed bandit (MAB) experiments allow you to do both at the same time.
The concept of MAB originates from poker machines. Remember the scene from Friends where Phoebe got into a fight with an elderly lady in Vegas? The lady was lurking behind Phoebe as she played different poker machines and stealing those that started to payout. MAB works in a similar fashion. It sends out many Phoebes, aka multiple arms, to test a number of machines, aka various versions. Based on the feedback it receives, it will start sending more traffic to the best converting variant. Gradually the model converges to the best performing version while still passing traffic to other variants in case performance pick up. If you operate in a market where the underlying user behaviours change frequently, having a living MAB model enables prompt adaption, aka allowing you to explore and exploit at the same time constantly.
Take the subscription page at the end of Calm on-boarding flow as an example. Calm’s growth team could design a number of variations, each with a subset of Calm’s subscription offerings and Unique Selling Points (USP) in different orders. These copies will then feed into the MAB algorithms, which will experiment while optimise toward the copy that returns the highest subscription rate. As Calm’s brand image matures, perhaps certain USPs become common knowledge and less important to advertise here. The algorithms will adapt and serve a different set of USPs which leads to higher conversion rate.
Alternatives to Testing
It is not always possible to conduct a split test. This could be due to technical or time constraints. However, you will still want to analyse the effect of the change. Many choose to compare before vs. after, e.g. 7-day period prior to the change vs. 7-day post change. There are limitations to this approach. For example, what if you are in a super growth period so any numbers from a later period will naturally be higher? Or if the change point happened just as you enter the low season?
To estimate the effect then becomes a time series problem, which takes into consideration trend, seasonality and noise. The Causal Impact package from Google, built based on the Bayesian structural time-series (BSTS) model is one way to solve this. Facebook’s Prophet is another notable solution but more focused on forecasting than causal inference.
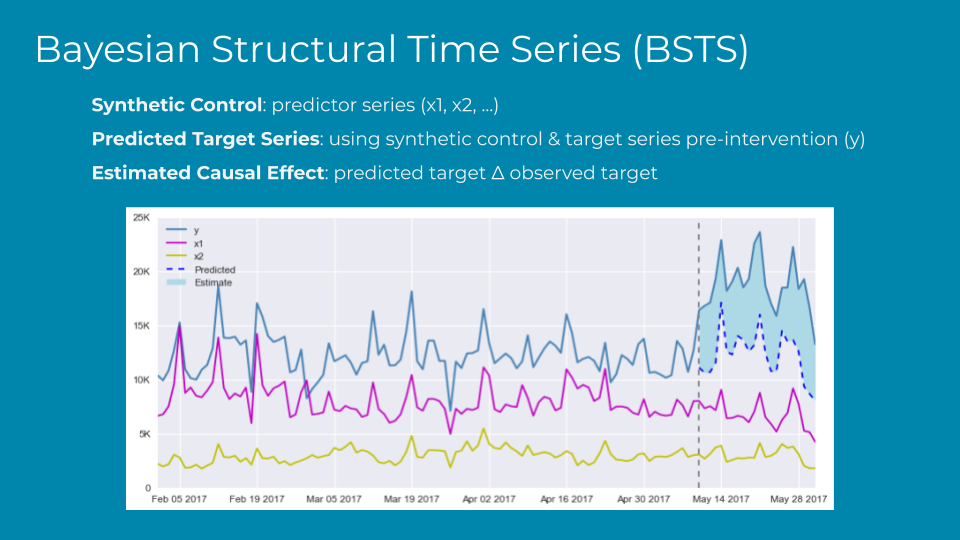
The key strength of the BSTS model is the construction of synthetic control using predictor series. Predictor series can be markets that follow the same pattern of your target series (the group that received the change) but was not subjected to or influenced by the change. Together with historical data of the target series, it is used to predict what would have happened had the target not received the change. The difference between predicted and observed target is the estimated causal effect of the change. There are many more intricacies and useful outputs from BSTS, which we will discuss in a separate post.