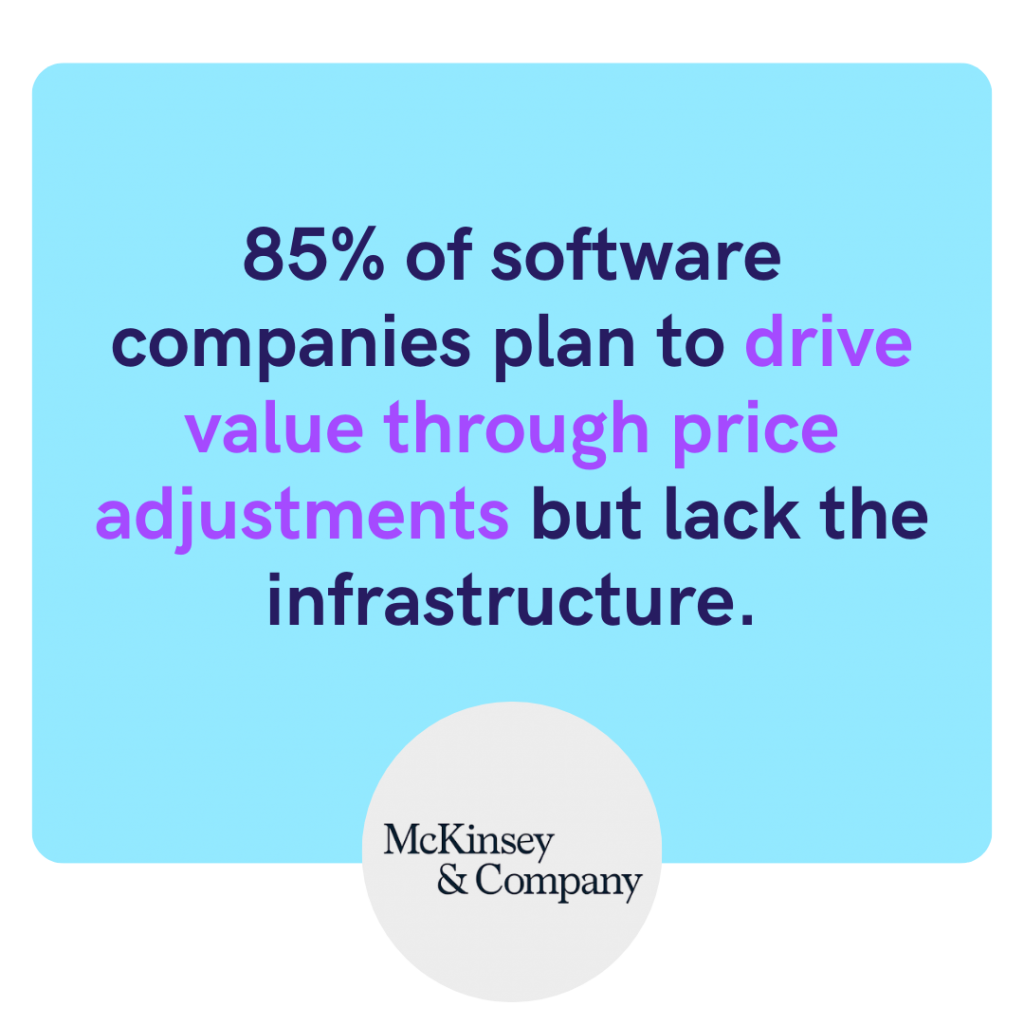
Failures in pricing often stem not from poor strategy, but from weak data infrastructure and misaligned systems across product, billing, analytics, finance, support, and sales teams.
Signal
Pricing decisions break in practice when underlying data systems and measurement capabilities aren’t aligned.
Stakeholders
Founders, CFOs, RevOps, Product, Finance, and Customer Success leaders responsible for optimising subscription pricing.
Strategy
Prioritise building a robust pricing data foundation that can enforce, measure, and inform pricing decisions before changing prices.
Introduction
Pricing is often treated as a strategic decision: debated in boardrooms, modelled in spreadsheets, validated with competitor research and willingness-to-pay interviews. The decision is made. The price changes. Then results diverge from expectations. Conversion drops instead of rising. Churn spikes in unexpected segments. Revenue grows, but not where the model predicted. The post-mortem usually reveals the same pattern:
The strategy wasn’t wrong, the implementation and measurement were incomplete.
Pricing changes do not land cleanly in the market. They ripple through product usage, billing logic, customer segmentation, revenue reporting, analytics, and support. If those areas are misaligned, pricing creates friction instead of control. Understanding pricing as a data + implementation challenge (not just a strategic one) is essential for pricing that works in the real world.
Why Pricing Becomes a Data Problem
Pricing has traditionally been owned by finance. Finance teams model unit economics, target margins, and competitive positioning, then propose price points. That approach worked when software pricing was mostly static. It breaks down in subscription businesses, where pricing is dynamic, usage-driven, and continuously iterated. Modern pricing is not owned by one team. It’s a chain of dependencies:
- Product defines value and usage patterns
- Engineering implements the tracking that makes usage measurable
- Billing enforces pricing rules and contract logic
- Analytics measures behavioural impact and segment outcomes
- Finance ensures revenue is recognised correctly
- Support absorbs confusion when pricing is unclear
- Sales negotiates within the constraints of packaging and billing
Each team owns a piece. None can succeed in isolation. When pricing is treated purely as a finance decision, it often gets approved without verifying whether:
- the product can measure what’s being priced
- billing can express and enforce the rules
- analytics can track impact reliably
- finance can recognise revenue without manual workarounds
- support can explain it without confusion
The result is pricing that works on paper but breaks in production:
- tiers based on unmeasurable usage
- discounts the billing system cannot represent
- promotions that create accounting complexity
- add-ons that break reporting and customer entitlements
Expert help is only a call away. We are always happy to give advice, offer an impartial opinion and put you on the right track. Book a call with a member of our friendly team today.
The Data You Need Before You Touch Price
Pricing relies on concepts that must be precisely defined before they can be implemented or analysed. These terms are often discussed casually, but ambiguity here is the root cause of most pricing failures. At minimum, you need clear definitions for:
1) Plans
A plan is a bundle of features and limits at a given price,but even that hides complexity.
For example:
- If the price changes but features do not, is it the same plan or a new one?
- If features change but price does not, what happens to existing customers?
- If you grandfather customers, how is that represented in data?
Your product, billing system, and analytics must all answer these questions consistently.
2) Entitlements
Entitlements are the bridge between pricing and product behaviour. The product should not check “plan name.” It should check entitlements, structured permissions like:
- “max_projects = 5”
- “feature_x_enabled = true”
- “max_seats = 10”
- “api_calls_per_month = 100,000”
This separation enables pricing flexibility, but only if:
- every feature maps to a defined entitlement
- entitlement rules live in data rather than hard-coded logic
- entitlement history is tracked over time

3) Add-ons
Add-ons complicate pricing because customers no longer have a single bundle. A customer’s entitlements become the combination of:
- plan entitlements
- add-on entitlements
- usage-based entitlements
- contract exceptions
Billing and reporting must support this without losing clarity. If you cannot answer “what did this customer actually buy?” reliably, pricing analysis becomes guesswork.
4) Discounts
Discounts are not just price reductions. They have structure. Discounts may:
expire
apply to specific products only
vary by volume
be fixed contractually (non-standard)
be tied to renewal or upgrade conditions
Without structured discount data, you cannot answer basic questions like:
Which discounts expire this quarter?
Which discounts are permanent and should never have been?
How much revenue do discounts cost us?
Which segments convert only when discounted?
5) Usage
Usage data underpins both billing and analysis. Even flat-priced products need usage data to understand:
engagement and activation
retention and expansion potential
which features drive upgrades
whether pricing aligns with real customer value
Usage must be:
granular
timestamped
reliably tied to customers and resources
consistent across environments and product surfaces
Price vs Value Metric (A Critical Distinction)
A common failure mode is confusing price with value metric.
Price is what customers pay.
Value metric is what customers receive.
If the value metric is poorly chosen (or cannot be measured reliably) the pricing model will feel arbitrary, and implementation will be fragile. Choosing the right value metric is both:
a strategic decision (what do customers value?)
a data decision (can we measure it accurately?)


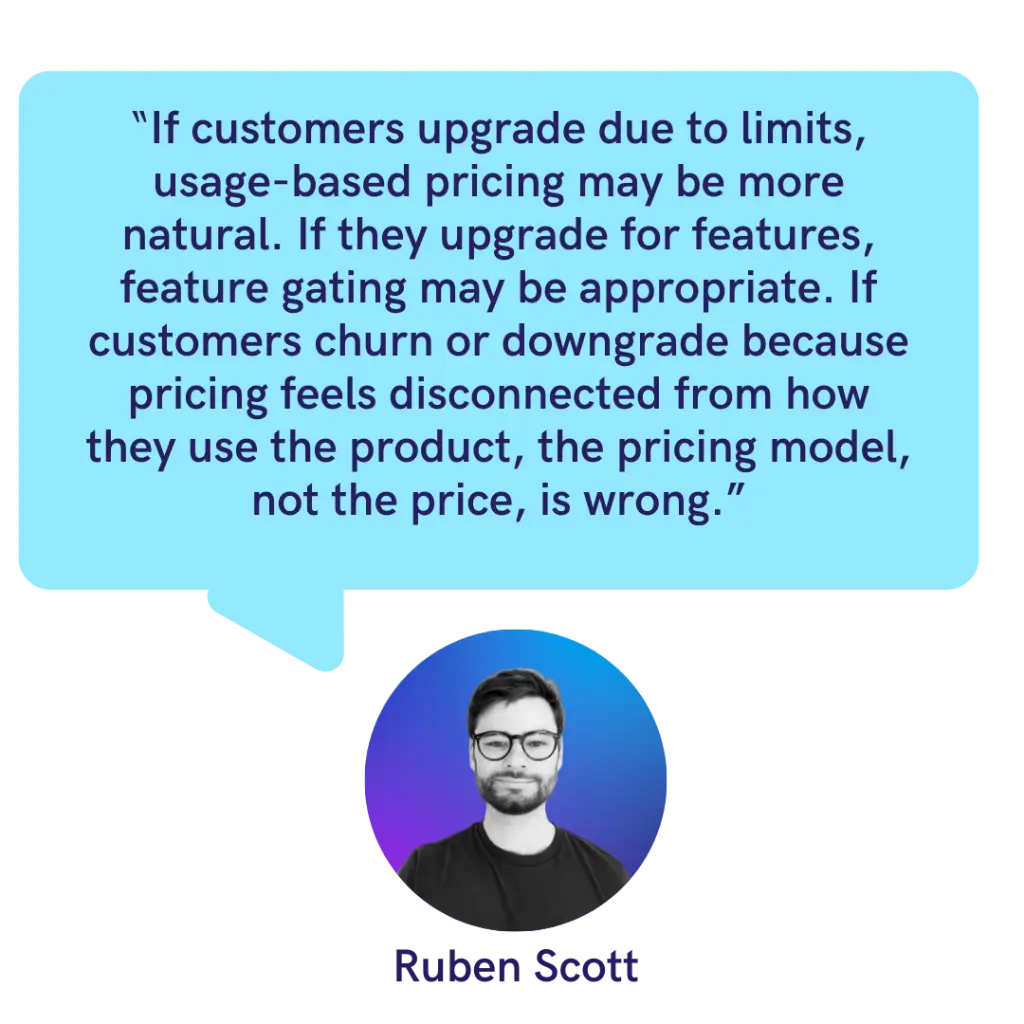
How Tiers, Feature Gates, and Limits Shape Behaviour
Pricing tiers do more than segment customers, they shape customer behaviour. Customers on the same tier tend to converge toward similar usage levels through selection and adaptation:
- those who exceed limits upgrade or churn
- those below limits adjust behaviour to fit
- those near limits reveal where value pressure exists
This produces a pattern that is extremely useful for pricing design: usage clustering.
What the data can tell you
Wide usage variance within a tier often means multiple segments are being forced together
Frequent limit pressure suggests tiers are too restrictive
Consistently low usage suggests limits are too generous
Power users are especially informative: they create outsized value, but are most sensitive to constraints

Pricing Produces Signals (If You Can Capture Them)
Every pricing interaction produces signal:
conversion timing
upgrade behaviour
downgrade triggers
discount sensitivity
churn after a price change
support tickets mentioning pricing confusion
Individually these signals are noisy. Together they are decisive, if you can connect the data.
Discounts are especially revealing
Who converts because of a discount matters more than how many.
Discounts that pull forward inevitable purchases destroy value
Discounts that unlock otherwise lost segments expand the market
Repeated discounts train customers to wait and negotiate
This is why discount data must be structured and analysable, not scattered across invoices and CRM notes.
The Minimum Data Model for Pricing Analytics
Effective pricing requires a dedicated analytical data model. This is not your billing schema and not your product database. It is a model designed to answer pricing questions reliably. At minimum, you need:
- Customers (with attributes for segmentation)
- Subscriptions (plan, timing, state history, discount history)
- Plans (versioned definitions, linked to entitlements)
- Entitlements (structured feature and limit rules)
- Usage events (customer + resource + timestamp)
- Billing events (invoices, credits, refunds, proration)
- Lifecycle events (activation, upgrades, downgrades, churn, reactivation)
Conclusion
Pricing decisions are only as good as the data infrastructure behind them. Strategy alone cannot compensate for systems that cannot enforce, measure, or learn from pricing changes. Pricing should not begin with: “What should we charge?”
It should begin with:“What can we measure, enforce, and learn from?”
How 173tech Help
At 173tech, we help companies make pricing changes safely by fixing the underlying infrastructure pricing depends on. That typically includes:
A clean pricing and subscription data model (analytics-ready)
Reliable usage tracking aligned to pricing metrics
Billing logic that can express tiers, add-ons, and discounts cleanly
Reporting that ties pricing decisions to retention, expansion, and revenue outcomes
Clear definitions for plans, entitlements, and contract terms
Pricing is hard. Our job is to take the operational complexity off your team; so pricing becomes testable, measurable, and repeatable.
Get In Touch
Our friendly team are always on hand to answer questions, troubleshoot problems and point you in the right direction.
