Granular data on learner journeys from discussion to advocacy
Objective
Implement bespoke reporting into a custom application.
Obstacle
Modelling core data concepts outside of a data warehouse.
Outcome
Interactive dashboards on key customer journey points.
Background
iRock School of Music partners with primary schools to offer in-school rock and pop band lessons, aiming to boost students’ confidence, foster teamwork, and provide opportunities to perform for their teachers, guardians, and peers.
To support its mission, iRock focuses on expanding outreach through targeted marketing, streamlining onboarding processes, and enhancing student engagement during the critical early stages of their subscriptions. They had custom-built software but needed more help in implementing reporting into it and turned to 173tech for some fast insights and implementation.
Challenges
Complexities in Student Journey: As part of a major initiative to improve the student experience, iRock undertook a comprehensive overhaul of the student journey. This required significant amendments to the existing database structures and business logic to align with the app layer. We worked closely with the iRock team to define their key metrics in a data dictionary and ensure that their backend was set up to capture all the data points we would need for the project.
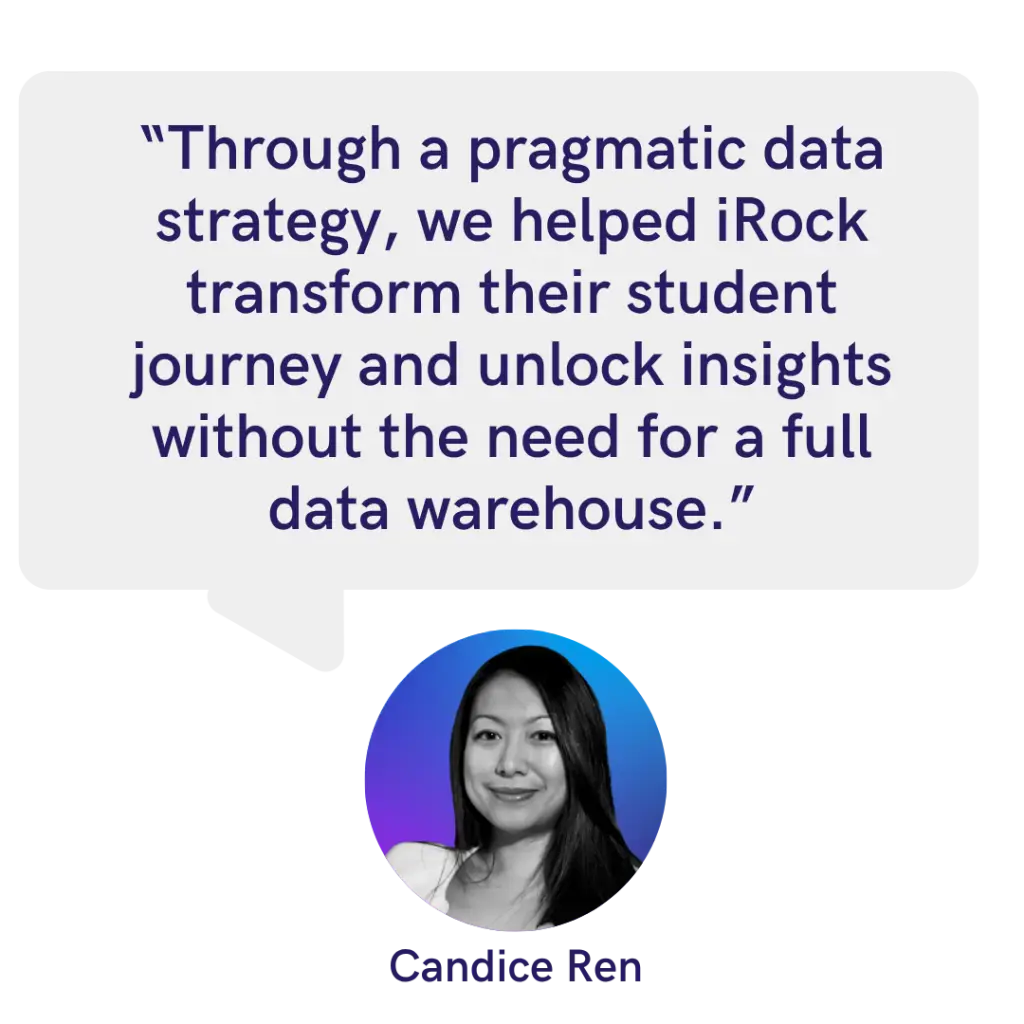
No Data Transformation: While we always recommend implementing a data warehouse as the ideal solution for centralising and transforming data, we also recognise that every business is at a different stage of its data journey. Rather than deploying a full-stack data infrastructure, which may have been excessive given the current scale and priorities, we opted for a more pragmatic approach. To ensure efficiency without overcomplicating the setup, we developed a lightweight ETL process that streamlined data ingestion and transformation. Instead of relying on a traditional data warehouse, we leveraged Metabase, a cost-effective visualisation tool that supports basic data modelling and reporting. This approach allowed us to provide meaningful insights without the overhead of a fully managed analytics stack.
Solution
Custom Visualisations: To address the need for accessible data presentations, we built intuitive visualisations in Metabase. These included tiles showcasing active schools, active students, school conversion and churn rates, student sign-ups, and graduations. These dashboards provided iRock with a clear view of their performance metrics, enabling non-technical stakeholders to understand key trends and make informed decisions.
Automated Reporting: We built a multi-tabbed Metabase dashboard to visualise key stages of iRock’s operations, from the student and school journeys to loyalty and advocacy metrics, providing tailored insights across engagement, conversion, and outcomes for full lifecycle visibility.
Impact
Student Journey Analysis: One of the key tabs in the dashboard focused on the student journey, offering detailed views of sign-ups, graduations, and churn rates. By analysing these metrics, iRock could pinpoint areas for improvement and enhance the student experience.
School Prequel Journey Insights: Another dedicated section of the dashboard highlighted the prequel journey of schools, from initial engagement through to conversion. These insights helped identify bottlenecks in onboarding and allowed the team to refine processes to increase school participation.
Advocacy and Loyalty Metrics: The dashboard also included metrics to track loyalty and advocacy, enabling iRock to measure the impact of their program on long-term engagement and identify opportunities to strengthen relationships with both students and schools.
Training and Handover: We worked closely with iRock’s team to ensure they understood how to navigate and utilise the dashboard effectively. This included walkthroughs of key functionalities and guidance on how to derive insights from the visualisations.
Creating Value For iRock,
We modelled 43data points across the customer journey,