


NLP and News Feed Scraping with SAYN
Natural language processing is quite a hot topic right now in data science. However, there are few articles that cover the whole process from extracting data to generating insights in a simple and concise way. It can be quite daunting as a newcomer, and it really shouldn’t be this way.
In the past, we would have to navigate the treacherous waters of Apache Airflow, but now we have a simpler way to define a Python based ETL by using SAYN. SAYN gives us the ability to write and sequence tasks in Python and SQL, like Airflow but with a simpler syntax and deployment.
In addition to simpler syntax, SAYN also has some convenient features like autosql tasks and presets which will simplify our code, more about these in a bit. Anyway, let’s get started.
In this project, we will be performing a basic NLP analysis on some current news articles. The scale of this project can vary drastically depending on our approach. To make our lives easier and to avoid making this article the length of a novella, we will focus on analysing BBC RSS feeds. These feeds are quite convenient to extract and provide a brief summary of current news articles, while some other feeds would require more tedious processing.
We will do the following:
- Extract article data from BBC RSS feeds
- Load it into our SQLite database
- Transform our extracted data
- Perform a basic text analysis on the transformed data
- Generate word clouds from the transformed data
If you would like to follow along or give the code a go you can find it here.
First, a little context is needed about why we should load our data into a database. RSS feeds are quite brief and are updated regularly. Storing this data in a database will allow us to accumulate more data over time, which should make our analysis more reliable.
Using a database will also simplify our data cleaning. BBC RSS feeds tend to function like stacks, where new articles are pushed to the top of the feed while the oldest ones are pushed out, so when we refresh we may gain an article while also duplicating the majority of previous entries. Storing our data in a database will allow us to clean the data with a simple SQL query compared to a complicated Python loop.
Lastly, it will allow us to organise our project data more efficiently using tables and views within the database. This is more of a cosmetic benefit but surely everybody can appreciate a less cluttered working directory.
Now that we understand the importance of using a database in this project, let’s break down the steps we outlined earlier.
Extract And Load
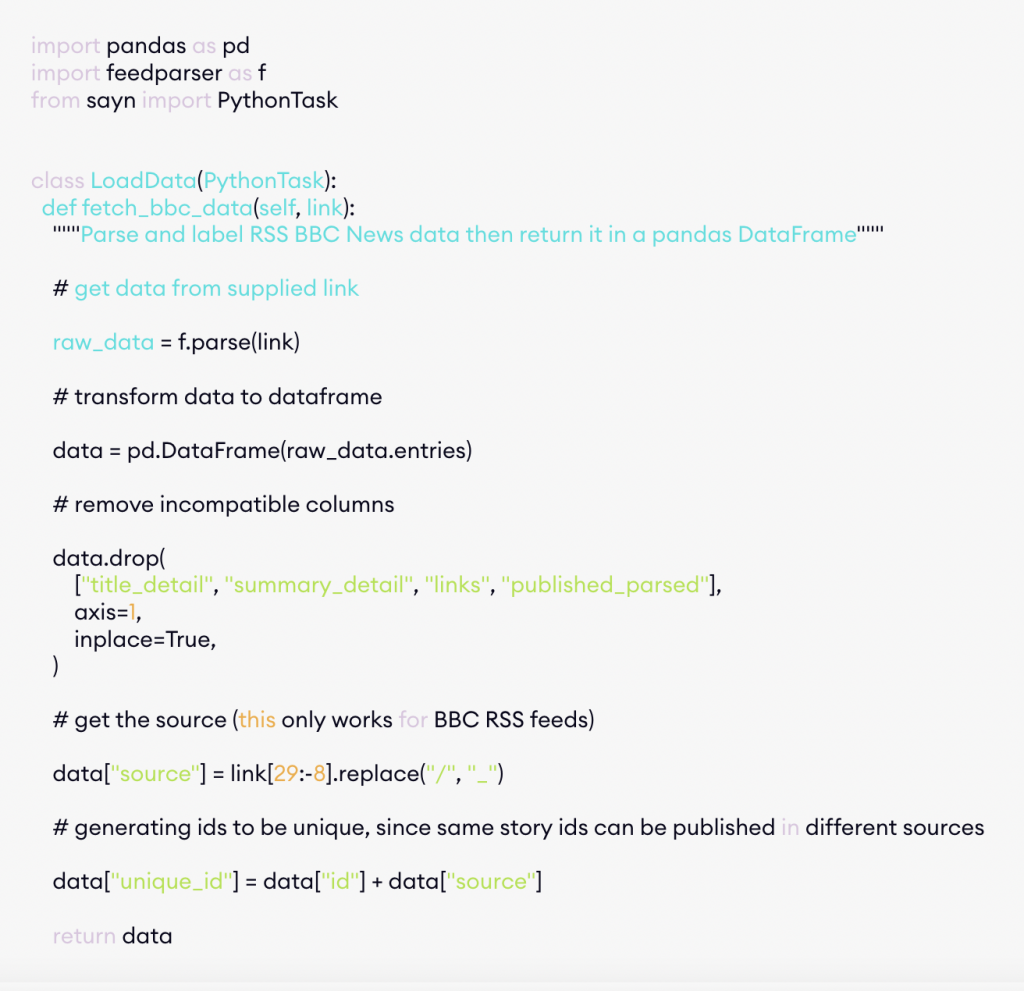
This part is quite straightforward, we will be using the package feedparser to extract data from our RSS feed links and load it into our pandas dataframe. Pandas is used here to drop some incompatible columns (these are just JSON objects of information we already have) and to add columns unique_id and source to make our lives easier later. The source is extracted from the URL links and will be used later in a group analysis, while unique_id is used to differentiate articles that share ids but are published in different sources.
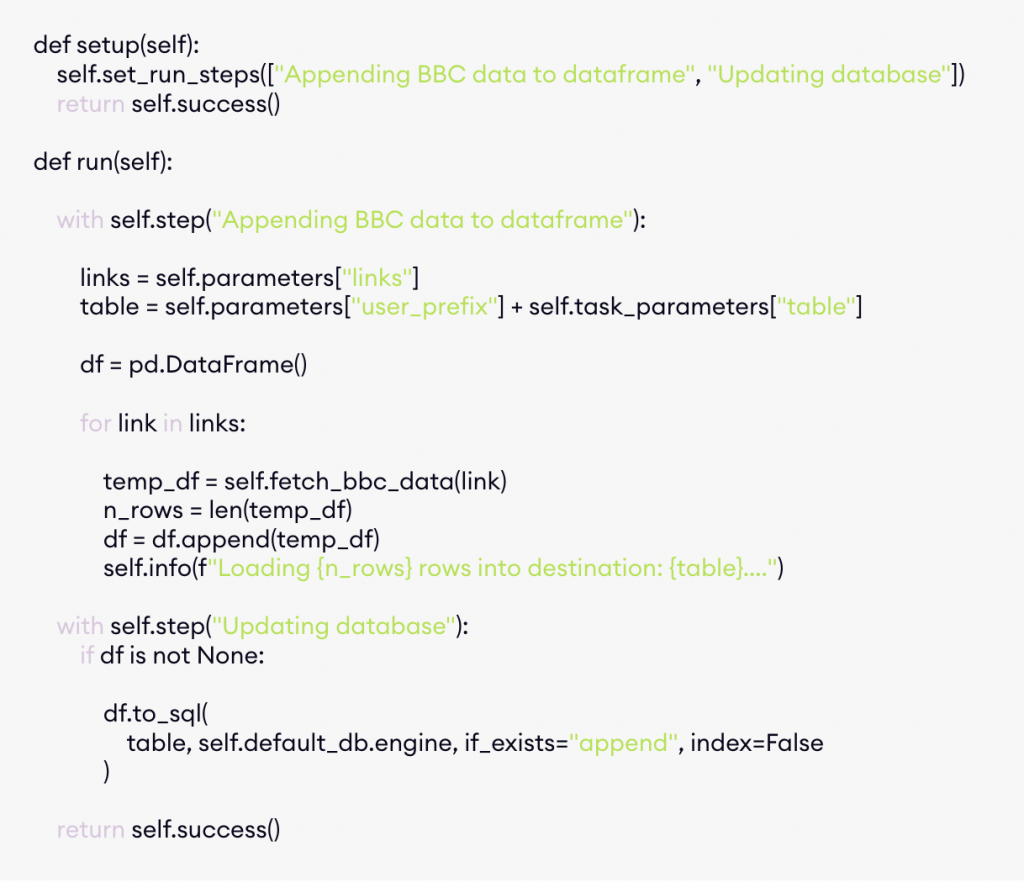
Now that we have our data, we can load it into our database using the pandas to_sql method. Please note that SAYN also has a method for this, but for consistency, we will stick to the pandas method.
Great, we have successfully extracted and loaded the data into our database, now we can move onto transforming the data we gathered.
Transform
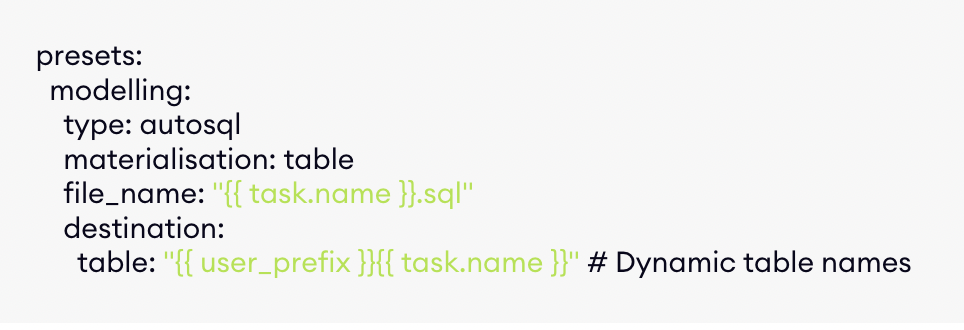
Our data has already been lightly processed during the extraction, however, we still need a SQL task to remove any duplicates that may appear in later refreshes. We can use SAYN’s autosql task for this, it will let us run a query and generate a table/view automatically. Since we plan to generate multiple similar autosql tasks, we should define a preset that can be reused throughout the project.
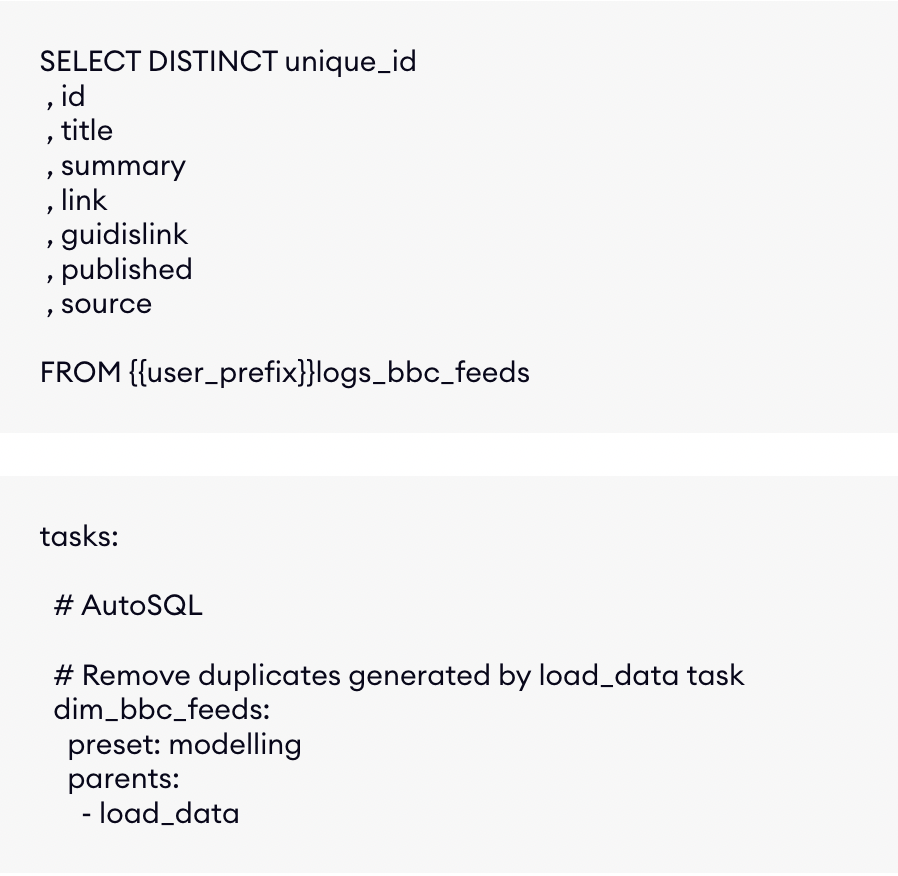
Presets are defined in the project.yaml file and allow us to reduce repetition when defining tasks. By defining properties in a preset, we can have our tasks inherit these properties and reduce the amount of code we need to write (we can always overwrite an inherited property by specifying it in the task definition). Presets also allow us to have dynamic names for the tables/views generated by our autosql tasks, further reducing repetition and cleaning up our code.
Analyse And Visualise
Now for the fun part, we will use two libraries for this analysis:
nltk(calculates basic text counts in our articles)wordcloud(generates word cloud visualisations)
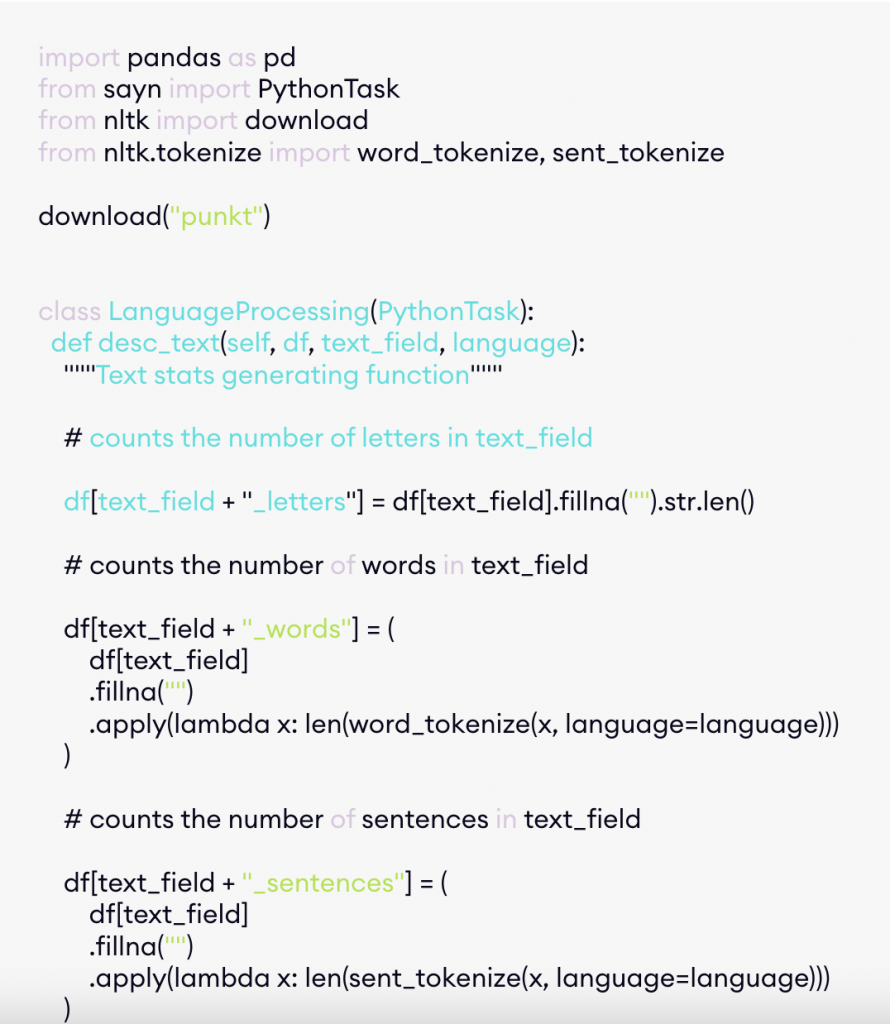
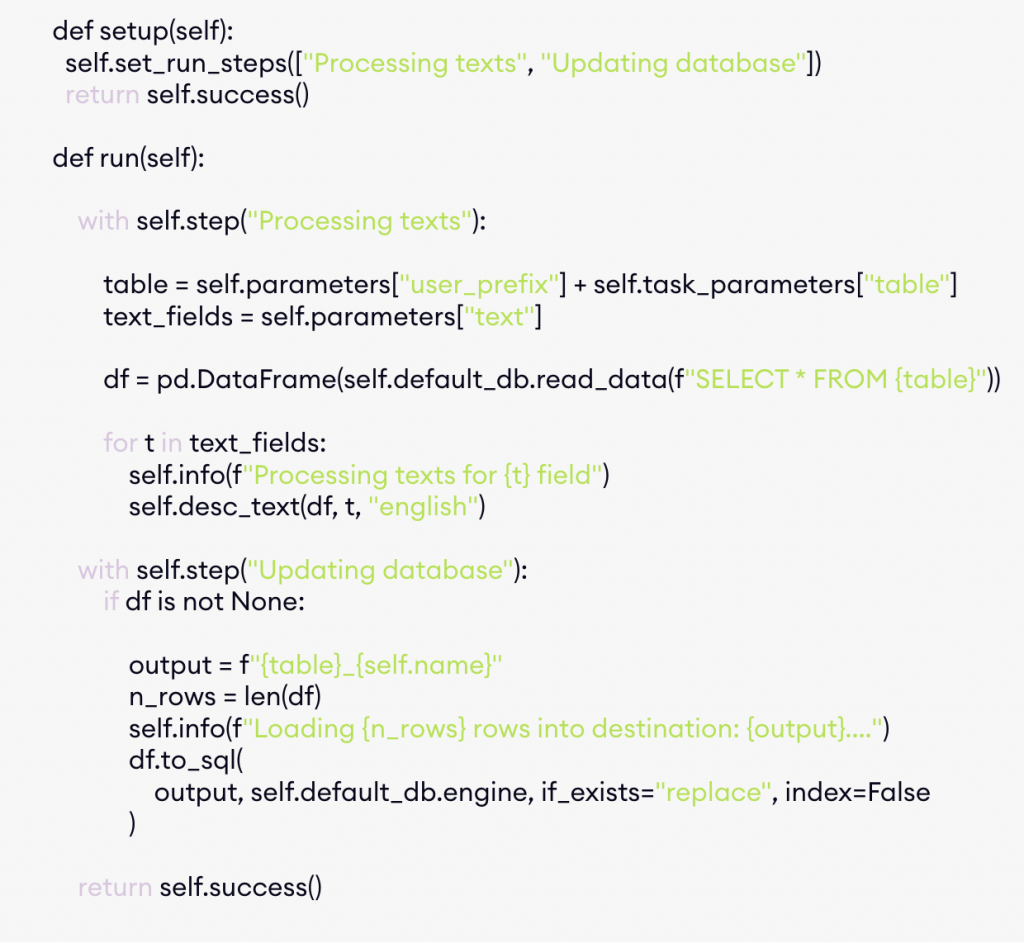
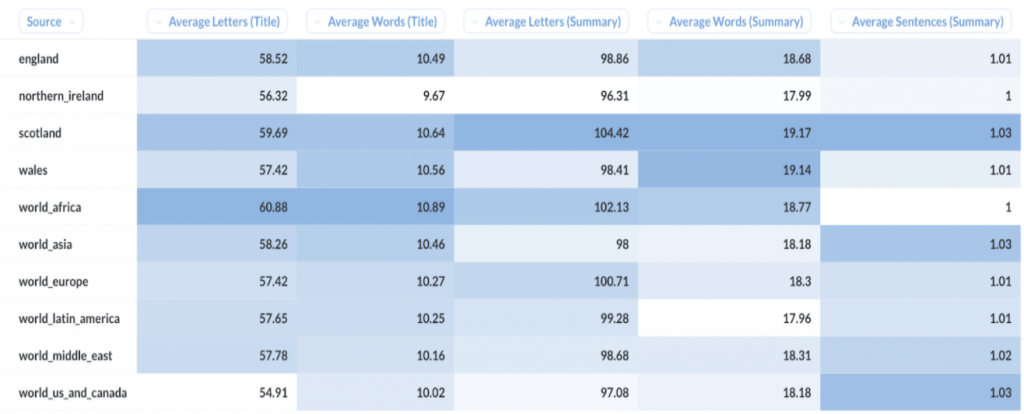
Let’s begin by calculating some basic text counts. Using nltk, we can get counts of letters, words, and sentences in the titles and summaries of the articles. These statistics can then be appended, as additional columns, to a copy of our cleaned dataset.
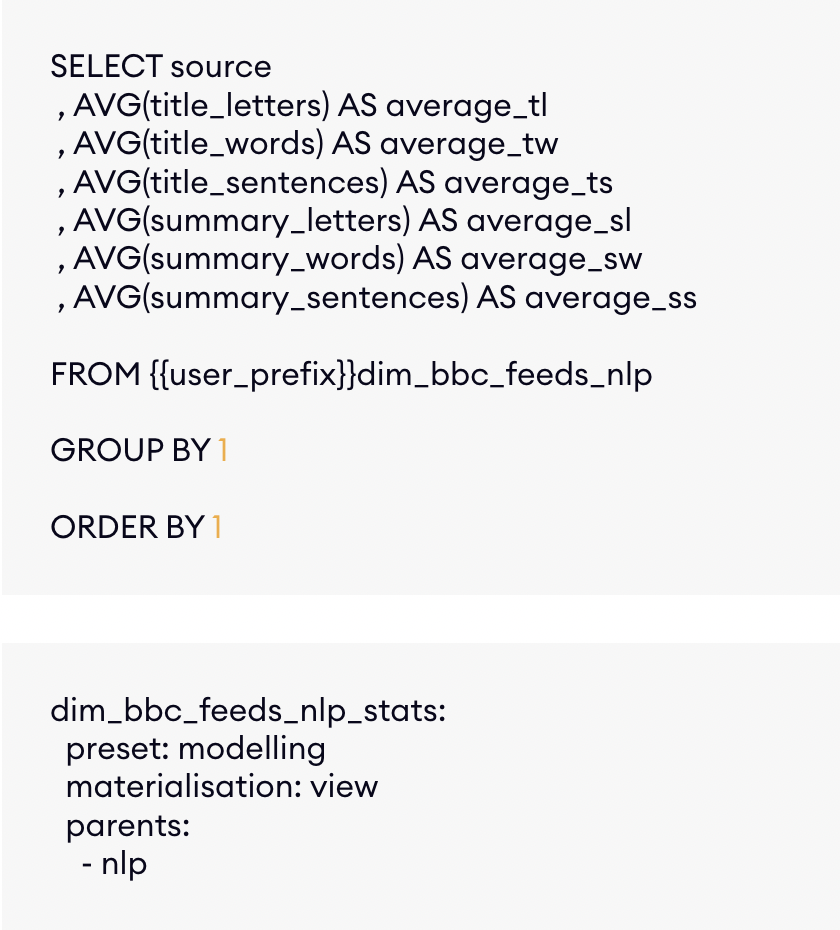
Now we can write a simple autosql task to generate summaries of our findings grouped by source. We can reuse our modelling preset to define the autosql task, although the materialisation of this task will be changed to a view. Brilliant, with just a few lines of code, we’ve managed to create a full text summary, grouped by source, within our database.
The statistics don’t reveal anything too surprising, we can mostly see that summaries tend to be longer than titles, although there is some noticeable variation for lengths of titles/summaries between sources (particularly length of article summaries from Scotland versus other sources).
While these statistics hint at some content variation, they don’t really show the whole picture. However, we still have another trick up our sleeve; the humble word cloud.
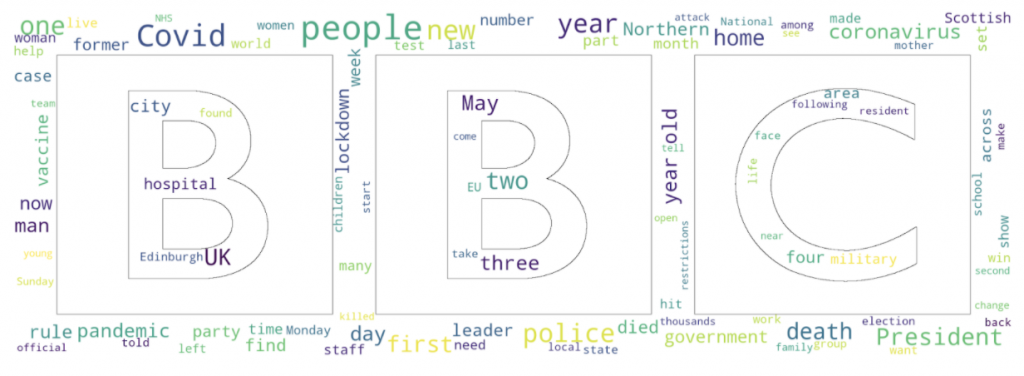
Initially, we can create a word cloud for all the article summaries we have. Summaries tend to be longer on average than article titles so they should provide us with more diverse word cloud visualisations.
Following this, we can generate a word cloud for each source in our dataset to see if any patterns emerge. We can also add source-specific masks to these word clouds for more visual variety. If you would like to use these masks for your visualisations, you can find them here.
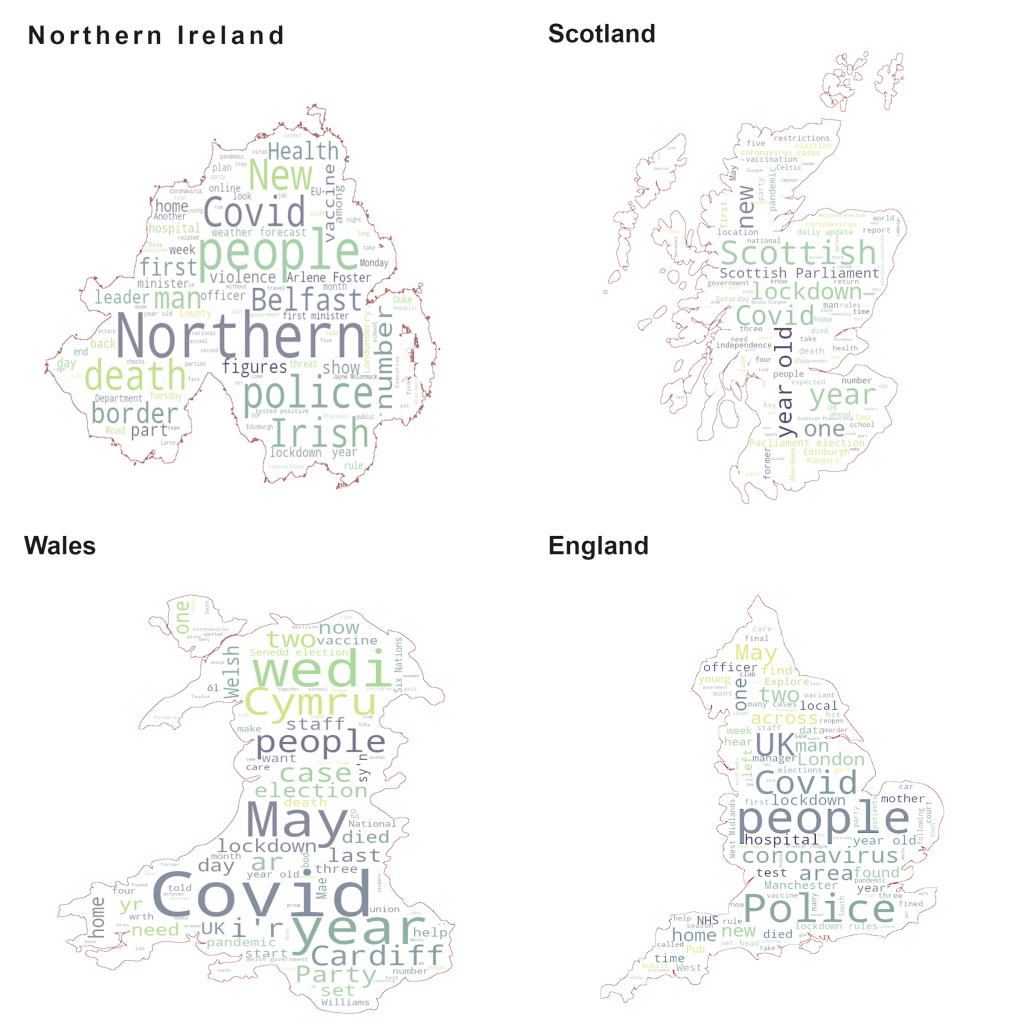

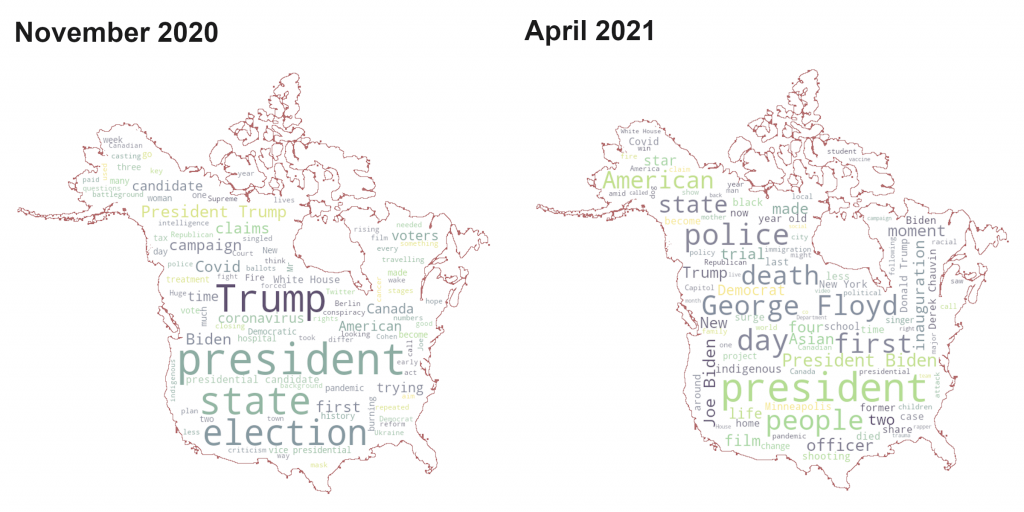
After examining the rendered word clouds, some common topics like covid and vaccinations emerge, however the frequency of these topics varies drastically from source to source. For example, covid dominates the news in UK sources, however, that is not the case for the US and Canada where this term, while still present, appears quite infrequently.
It is also interesting to see how the topics have evolved over time, here is a snapshot of the US and Canada topics in November 2020 compared to now. While there are some similarities, the dominant topics are clearly different.
Conclusion
While this project has provided us with some insights about the current state of the world, at least from the perspective of the BBC, it could be expanded further by integrating more sources or by using a more sophisticated analysis.
In the end, this is a relatively simple project, however it can easily be expanded upon with the above suggestions thanks to the power of SAYN. I think this article really showcases how simple data workflows can be when using the correct tools, and I hope it has encouraged you to try using SAYN in your projects.
If you would like a more detailed overview of the code and concepts used in this article, you can find it here.
If you have any specific questions about SAYN or the project in general, you can reach out to us on hello@173tech.com.