


How To Measure Retention
We’re all probably familiar with the stat that it costs 5 times more to acquire new customers than retaining existing ones and that increasing customer retention even by 5% can more than double the boost in revenue as well. (Deloitte) As such understanding and improving your retention rate is critical to any business.
Retention Definition
When measuring retention, the first consideration is your definition of a retained user. Here are some common approaches ranked by complexity from low to high.
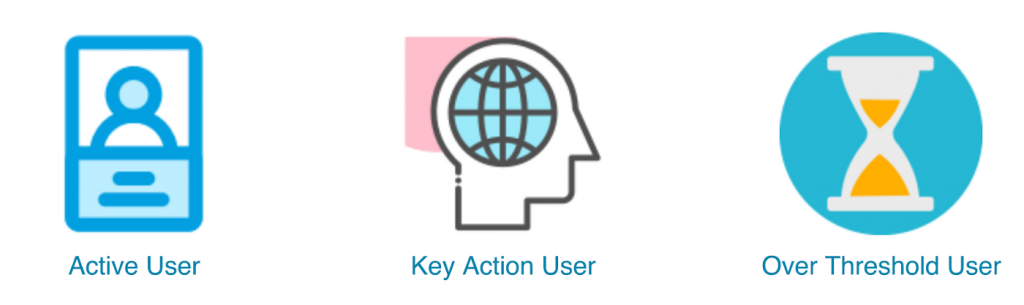
- Any user who returned to any of your platforms, aka active users.
- Anyone who performed a key action, e.g. reading an online article or swiping on a profile or making a purchase.
- Anyone who crossed a threshold of activity levels, e.g. spent more than 30 seconds reading an article. It could also be a combination of different types of activities.
Active User Retention
Active Users = Any user who returned to any of your platforms
At the beginning of your product journey, the active-user approach is easy to implement and a good indicator of product market fit. The downside is that there are ways to artificially inflate active user figures with no underlying positive or sometimes detrimental changes in your service.
For example, if you sent out an email or push campaign with ‘clickbait’ messaging. A proportion of users are bound to click and land on your app, which leads to an increase of active users hence retention. After realising nothing has improved in the app, these users will disappear again. Some will unsubscribe and you lose that communication channel with them forever.
Key Action Retention
Key Action Retention = Anyone who performed a key actions defined by your business, e.g. reading an online article or swiping on a profile or making a purchase.
As you scale, consider moving to an action-driven approach, which makes your retention indicator more meaningful. For example, if you are an online streaming service, qualify retention on users who have played a video. That way you avoid vanity measures that include active users who browse your catalog forever without finding anything interesting to watch.
If you prefer to keep active-user retention for historical consistency, then monitor both retention and engagement. If you observe a jump in retention, ensure usage levels have moved accordingly.
Threshold Retention
Threshold Retention = Anyone who crossed a threshold of activity levels, e.g. spent more than 30 seconds reading an article. It could also be a combination of different types of activities.
The next level up is to improve on a binary qualification based on a single action to a threshold driven by the intensity of an action or a collection of actions. For example, instead of users who clicked open a film, qualify on users who watched at least 5 mins or more of content.
If you are a social app such as Instagram, you could define retention as users who performed any of the core actions: post a picture or story, like or comment on others posts, start a live streaming etc.
Not all types of core actions are equal. For example, a live streaming event is likely to generate more network effect than someone liking a post. How do you balance it? You can assign weights to different types of actions and then add them up as the daily activity score per user, e.g. a live streaming event is worth 10 points, a photo post 5 and a like is 1. If a user liked 5 posts and live streamed once and posted 3 pictures in one day, his or her activity score of the day is (5×1) + (3×5) + (10×1) = 30 You can then apply an activity score threshold to define retention.
How do you decide on the weights of each action and the overall threshold level for retention? They should be the results of modelling towards customer lifetime value (LTV). The level of activity intensity that correlates highly with desired user behaviour and your power users.
Retention Window
The next concept to define is the time period and frequency to measure retention.
A closed window retention is the percentage of users returning on the day or within a week or month. An open window is the percentage of users returning either during or after the period, i.e. the inverse of churn.
The frequency will depend on the usage pattern of your service. For example, if you have a monthly subscription model then you might want to monitor monthly subscription retention. For a social app such as messaging, daily retention might be more appropriate.
Retention Cohort
Once you have your retention metric, visualise it by registration cohort to monitor and detect trends. Registration cohort is users grouped together by their registration time. You can aggregate it on different time intervals, e.g. daily or monthly. Make sure to count distinct users to avoid duplicates.
Heatmap
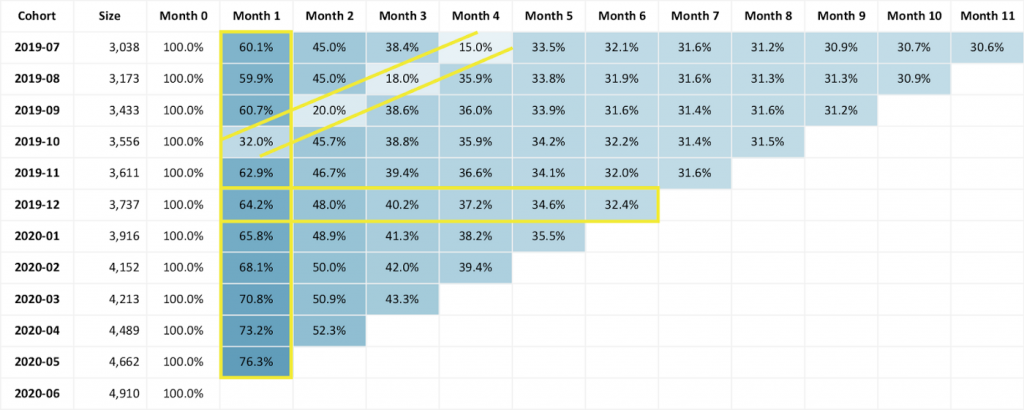
Below is a heatmap of monthly retention figures by monthly registration cohorts. Heatmaps are useful when examined in three ways. Horizontally it shows how a particular cohort is retained over time. Vertically, and most importantly, it shows how your app retention is evolving. Ideally, it gets darker going down, i.e. retention is improving over time. Diagonal view can act as an alert if you spot a different colour pattern. In the example below, the lighter diagonal strip suggests something went wrong in Nov 2019, i.e. month 1 of 2019–10 cohort.
Retention Curve
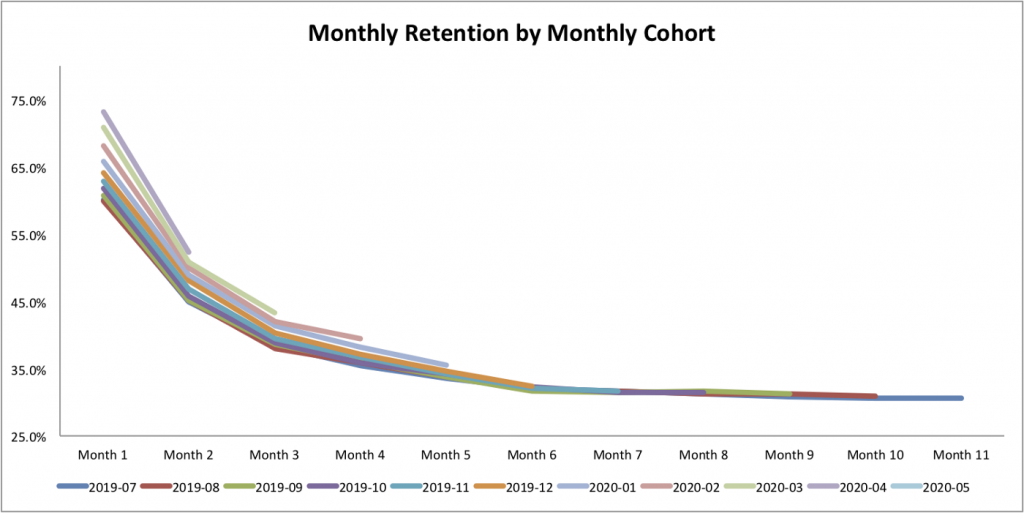
The other view that is useful in monitoring trends are retention curves by cohorts. The example below shows retention over time for each monthly cohort. You should hope to see newer cohorts moving upwards.
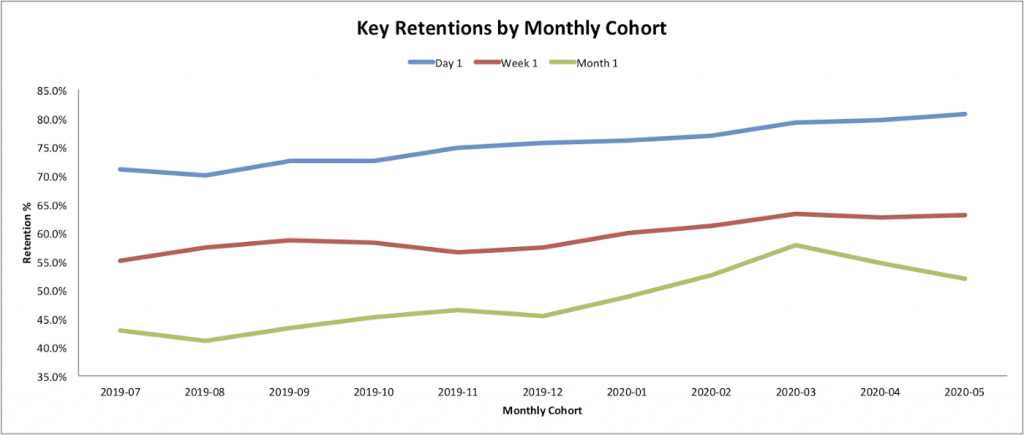
Another way is to visualise the progression of key retention metrics over registration cohorts. These key retention metrics should be where you see major drop-off points in retention rate. They are usually at the very beginning of the user journey or after certain user actions or product cycles. Below is an example of day 1, week 1 and month 1 retention trend over monthly registration cohort.
Feature Retention
In addition to overall product retention, you can also measure the performance of each component of your product, i.e. feature retention by first usage cohort. Instead of time-based intervals, you can consider using action frequencies. For example, when Uber released the Spotify integration, what percentage of users come back to this feature in their subsequent rides? If you operate a subscription model, it is important to track and analyse subscription retention rate by cohort of first subscription date.
Taking It Up A Notch
Retention And Churn Propensity Prediction.
So far we have discussed retention as an aggregate on cohort level. As your user base grows and collects quality data for three to six months, you can start training data science models to predict retention score on an individual level. The model will also give other meaningful outputs such as feature importance which can guide you to key insights,
In the past, we have experimented with models that predict future retention at different time intervals, e.g. day-1 retention with users’ 15 minutes of activity data or day-14 with first hour data.
These models can be integrated into your product and marketing strategy and will play a crucial role in improving customer experience. For example, you can design tailored in-app flows based on retention score buckets, send personalised offers if a user’s score falls below a certain threshold and about to churn, or prompt users with how-to guide if they are new and fail to reach your desired action.
LTV Prediction
It should come at no surprise that retention also correlates highly with Lifetime value. You can easily retrain or reclassify your retention model into LTV predictions. If your monetisation pattern is fairly unvaried such as Netflix’ monthly subscription model, you can estimate aggregated LTV by demographics without complex data science algorithms.
In Conculsion
What gets measured, gets managed. Understanding and predicting your retention and churn is crucial to identify key moments of intervention and understand the actions which will drive long-term adoption and loyalty. If you want help adopting a data-driven approach to retention, why not get in touch with the friendly team at 173tech?