

Getting Started With eCommerce Analytics
All roads lead to Rome. When it comes to eCommerce analytics, there are almost too many available routes. You might be juggling insights from multiple service providers like Shopify, Facebook or Google Analytics; number-crunching manually in Excel; or bending and twisting tools like Mixpanel or Supermetrics to fit your unique business needs. These routes are time consuming, error prone and costly as you scale.
At 173Tech, we believe data should be easy and actionable for everyone to help drive more sales, keep customers happy, and reduce costs.
In this post, we will show you how to get your analytics stack up and running quickly that helps you grow in the following areas:
- Ability to centralise and analyse data from all customer touchpoints.
- Acquire new customers cost-effectively.
- Increase sales and customer lifetime value (LTV).
With an agile and scalable infrastructure in place, you can then model additional data sources and build algorithms to boost your own data-driven competitive advantage.
Set Up Your Data Stack
One of the key problems for brands is that different tools (facebook, shopify, google) will give them different numbers for the same metrics. In order to start leveraging data, you need to create one version of the truth by setting up your own data stack.
We have a lot of articles that go into the components of a data but in brief:
- Your data sources are where your information will come from.
- You need a way in which to extract the data your business needs.
- You need a place to store that data, a data warehouse.
- You then need to model that data in line with your business logic.
- And a way to display that data back to your organisation with a reporting tool.
We typically recommend starting with your core data sources. and then expanding. Extracting and modelling everything at the start will add considerable time and cost to your data setup. Once you have this solid foundation in place, you can plug and play any additional data sources seamlessly.
The ultimate goal is to connect all relevant information for the most comprehensive view over your customer journey, and to build data science solutions to optimise it at every single step.
Organise & Model Key Data
Sales Data
Sales data is always a good starting point as it will help inform a lot of the modelling to come. Automate the data extraction from your eCommerce platform, transform it so that your unique business logic is applied (ie do you offer returns ion 28 days and not 30) and visualise.
Automate eCommerce Data
Most eCommerce platforms provide an API where you can plug in and pull raw data at your preferred time interval (e.g. daily) into your own data warehouse. Extract order level records with all the details. If you built your own eCommerce solution, we can connect directly to the operational database and automate data load.
Transform Revenue Data
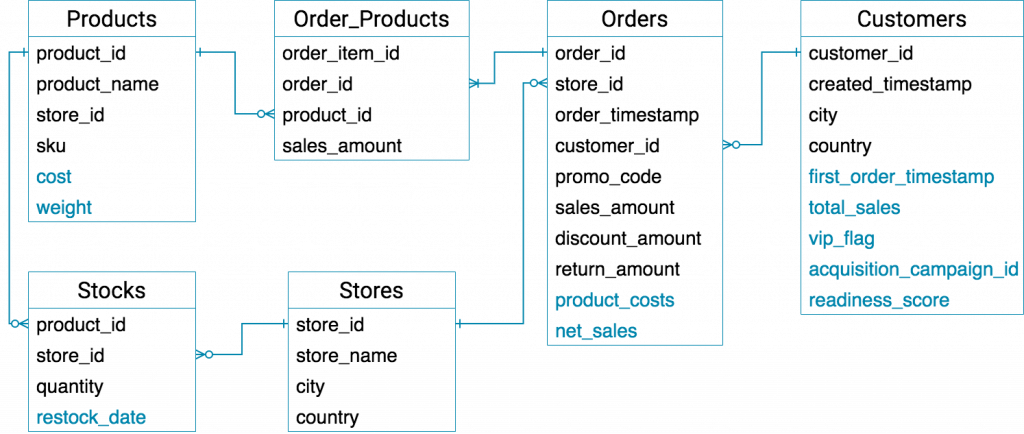
Next connect all the data dots and arrange them in a meaningful way so you can easily build and tailor reports from any angle. Below is a sample data diagram of key data (e.g. Orders, Order_Products) and dimension (e.g. Customers, Products) tables linked together by unique identifiers (e.g. customer_id), which will be the bedrock of your reporting.
You might have noticed some columns in blue which are not directly available from raw eCommerce data. These are examples of modelled fields that can dramatically increase your analytics capabilities and speed.
Integrate Cost Of Goods Sold (COGS)
A simple way to model COGS is to record it in the Products table then model into Order_Products, so you can easily aggregate and manipulate in the same way as sales. For more sophisticated COGS tracking, check out our eCommerce Analytics Playbook, details at the end.
Automated Dashboards
With revenue data in place, you are ready to build automated dashboards that are tailored to your business and easily digestible. Start with a Master Dashboard covering key growth indicators for a quick and up to date bird’s-eye view. It will evolve as you integrate more data sources.
Focus On The Customer Journey
Increase Customer Lifetime Value (LTV)
Customer LTV is a crucial insight for any eCommerce business. It can be used to allocate and optimise digital spend, build high value audiences, segment and tailor CRM strategies and more. To increase customer LTV, optimise on its two key components: basket value and repeat purchase rate (aka customer retention).
Basket Value
Analyse your basket data to get a good understanding of what product(s) customers are buying and the distribution of spending. Then try the following ideas…
Examine product groups that are currently purchased-together for any cross-sell opportunities are missed.
Build algorithms to optimise the display of relevant products so that they are shown dynamically.
Create A/B (or multivariate) testing funnels on:
- Copy describing the benefits of multiple products working together.
- Discounts on product bundles or up-selling to a larger size or quantity.
- Timing for cross-sell and up-sell recommendations. We usually see this being right after a product is added to the basket or during check out.
- Timing for prompted discount codes. Try postponing it to later stages of the buying funnel. If a new customer is willing to buy at full price, discounting it too early will sell yourself short.
Repeat Purchase Rate
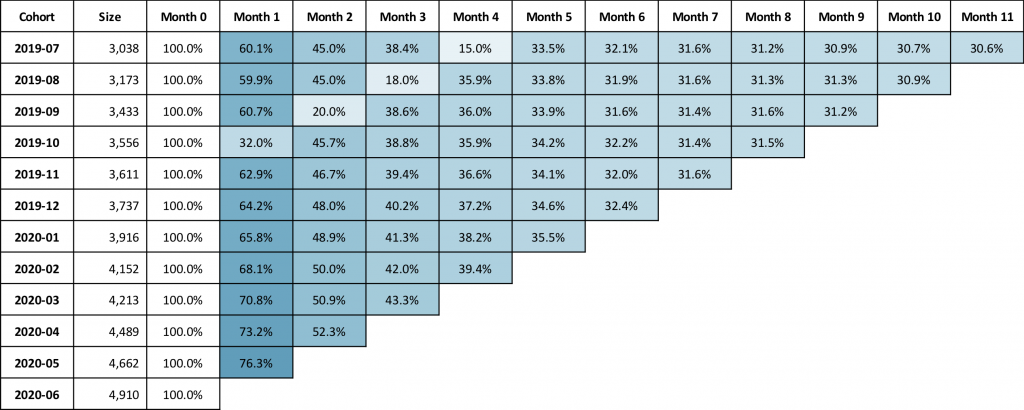
The more frequently customers come back and purchase, the higher their LTV. Analyse the distribution plot of how long it takes for a customer to make the next purchase. Also examine if this duration is shortening over time or among cohorts, and what percentage of customers never made a second purchase.
If the repurchase pattern is fairly consistent among your customers (e.g. every 3 months), when do they become ‘sticky’, i.e. customers are loyal and their behaviour is predictable? Identify this loyalty moment and you have found your North Star.
Subscription Model
Providing a subscription service is a great way to increase customer retention and LTV. It saves customers time and effort going through repeated buying processes, and ensures a more predictable stock level and revenue forecast for eCommerce businesses.
If you operate a monthly subscription model, retention analysis and churn prediction and prevention are your top priorities after customer acquisition. Your North Star metrics are undoubtedly:
- Monthly Recurring Revenue (MRR)
- Month X Retention, X being the point that correlates to customer loyalty and long term stickiness.
Your modern analytics stack ensures a consistent and accurate view on these critical KPIs over time.
Predict Customer LTV
Based on historical data, you can build prediction models on customer LTV at the moment of their first purchase. The more details you have on your customer (e.g. acquisition, demographic, purchase details etc), the more accurate your results. Among many use cases, predicted LTV can be used as an early signal to optimise your digital spend.
Integrate Marketing Data
To optimise digital spend towards LTV on all campaigns and channels, automate data extraction from marketing platforms via API connection, and unify tracking standards across all channels with UTM parameters.
From here, you will be able to allocate spend data to individual transactions based on UTM attribution, and apply LTV prediction at transaction level and aggregate for campaign ROI. You can also build algorithms to generate optimisation recommendations at your desired frequency to guide marketing budget allocation.
Marketing Analytics is of course a whole subject on its own, but we always recommend that it is better to start off by thinking about your logistics of your products, your customer journey and then think about the sales and marketing funnel.
How 173Tech Can Help
If you want to optimise what your eCommerce business is doing and need granular data to achieve that, why not get in touch with the friendly 173tech team today.