
Data salaries have shifted dramatically over the last five years, and the patterns are more complex than any single number can capture. Understanding what’s actually driving those movements changes how you hire.
Introduction
Earlier this year we published one of the more useful free resources we’ve put out: a data salary review covering 23 cities, four roles, and five years of data. We pulled from Indeed, Glassdoor, LinkedIn, Salary Expert, Reed, Bulletin, Talent, Statista, The Salary Checker, Total Jobs, and NerdWallet to build average salary figures across 2020 to 2025.
A word of caution before we get into it: this is averages on averages. By definition that skews slightly higher than reality, and in smaller tech hubs a handful of large employers can inflate the numbers quite significantly. Treat it as a directional compass rather than a precise reading. With that said, the patterns are real and worth talking about.
There were three findings I wanted to highlight. And for each of them, I’ll make the point that knowing the number is only part of the problem.
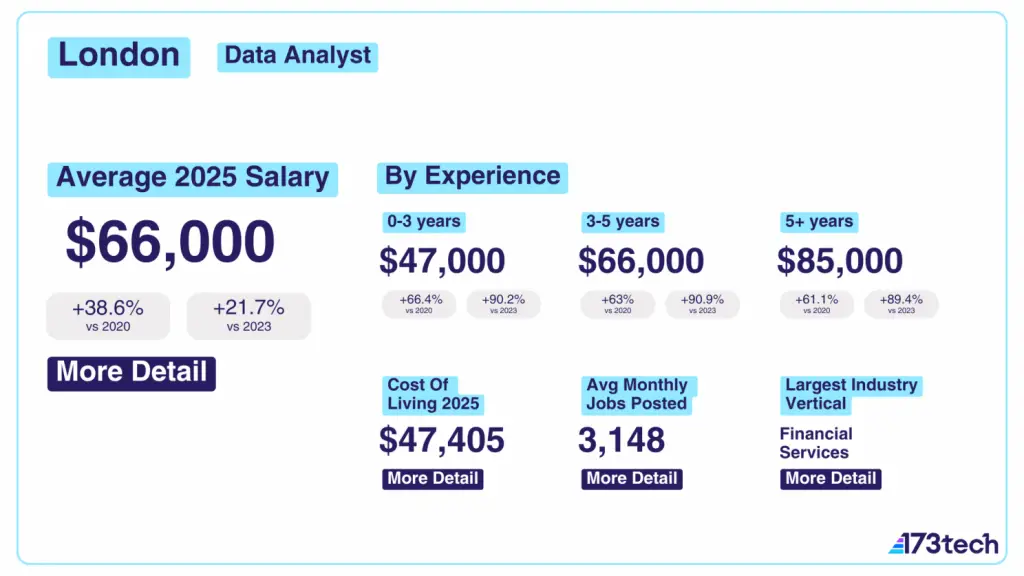
Finding One: Data Analyst salaries have nearly doubled in london
*All figures are in USD, normalised to allow fair comparison across all 23 locations.
In 2020, a junior data analyst in London was averaging $31,200. By 2023 that had risen to $42,400, a 36% increase in three years. At intermediate level the move from $41,600 to $60,000 is a 44% rise. At expert level, from $52,000 to $76,000, it’s 46%. By 2025 those figures have continued climbing: junior analysts at $47,000, intermediate at $66,000, expert at $85,000.
Three things are driving this. First, London is a genuinely top-tier global data market, not just a strong European one. Financial services dominates the employer mix; 119,452 data job postings from financial services in our dataset versus 77,498 from tech and financial services raises the floor for everyone. Second, UK inflation has been severe. People aren’t necessarily wealthier in real terms; many are running to stand still against a cost of living that’s risen 12.25% year-on-year in London. Third, the role has got harder. Junior hires are now expected to arrive with SQL, Python, Looker, Power BI, and some working understanding of data engineering. The bar is higher.
For employers, this matters in a way that the salary table doesn’t fully capture. Knowing the average is one thing. Knowing whether the candidate in front of you is worth the average, whether they’re at the top or the bottom of that range given what you actually need is a different question entirely. That’s where having someone with genuine market knowledge in your corner changes the outcome. Not just benchmark data, but a considered view of whether this person, in this role, at this number, is the right call.
Finding Two: The UK posts more Head of Data roles than the US
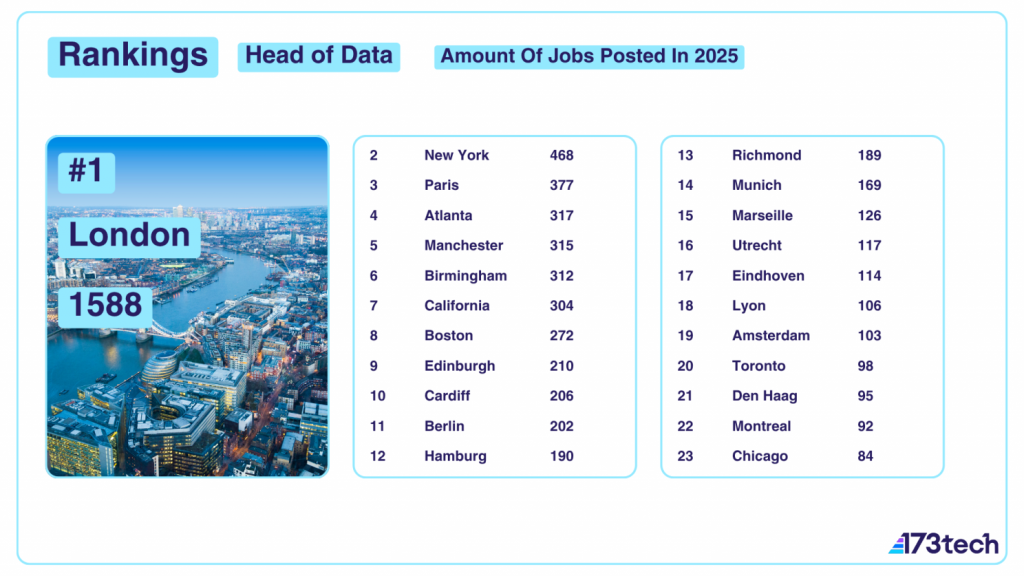
London averages 119 Head of Data postings per month on LinkedIn. New York is second at 39. Paris third at 31. California, the largest tech ecosystem on the planet, sits at 25. That gap is striking. But it doesn’t mean what it might appear to mean.
In the US, a Head of Data hire typically means there’s already a data function that needs strategic leadership. In the UK, roughly half the companies I speak to have no meaningful data infrastructure in place at all. Many of the rest have something built by whoever was available at the time, often not by someone with a data background. The volume of UK Head of Data roles reflects that the UK is still building foundational data capability. These are frequently one-person teams. The Head of Data is also the analyst, the engineer, and sometimes the BI developer. They’re not managing a function, they’re creating one.
The salary data reflects the risk: London Head of Data wages average $168,333 in 2025, against $247,000 in California and New York. More complexity, less money.
For employers posting these roles, the brief rarely survives contact with the market intact. What the job description says and what the organisation actually needs are often quite different things, particularly when infrastructure is immature and the scope of the role will inevitably expand. Getting this hire right matters disproportionately. A mis-mash at this level is expensive in time, money, and organisational momentum. It’s exactly the kind of appointment where the cost of a placement fee is trivial relative to the cost of getting it wrong.
Expert help is only a call away. We are always happy to give advice, offer an impartial opinion and put you on the right track. Book a call with a member of our friendly team today.
Finding Three: Data Engineers have had the most volatile ride
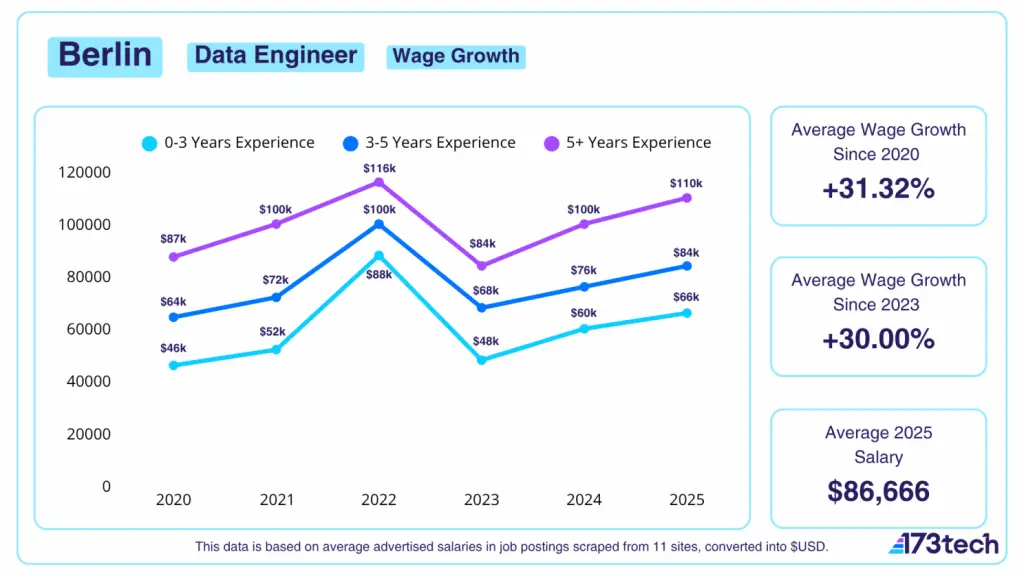
Data engineer salaries haven’t followed a growth curve. They’ve followed a seismograph.
Berlin is the clearest example. A junior data engineer earned $46,000 in 2020. By 2022 that had jumped to $88,000. By 2023 it had fallen back to $48,000. Intermediate and expert levels tell the same story. Munich, Hamburg, and most other major markets show the same spike-and-correction pattern.
The mechanism is straightforward. Post-Covid, companies that had deferred technology investment came back to market simultaneously. Data engineering was correctly identified as the enabling capability for everything else in data, so demand spiked sharply and salaries followed. A cohort of people entered data engineering in 2022 on the strength of that demand who perhaps weren’t fully ready. By 2023 the correction had arrived: overpaying had occurred, the market cooled, and that cohort found itself in an awkward position; too expensive for their output, not experienced enough to move up.
This is the pattern that makes data engineer hiring particularly hard to navigate using published data alone. The headline five-year growth figures look compelling; Montreal at 65%, Manchester at 53%, Cardiff at 44% but the shape of that growth matters as much as the total. Most of those gains came in 2021 or 2022 and then partially corrected. Hiring at the peak cost organisations real money. So did the resulting attrition when people on inflated salaries moved on once the market normalised.
For employers currently hiring data engineers: the market has partially recovered and demand will increase again as AI implementation drives the need for robust data pipelines. But experience depth now varies enormously within the same job title and salary band. Distinguishing between the engineers who genuinely had the depth to justify 2022 salaries and those who were carried by the market is exactly the kind of assessment that’s difficult to make from a CV and an interview alone.

































Conclusion
The full dataset is free on the 173tech website, filterable by role, city, and experience level, with a PDF download available. Everything is in USD for cross-market comparability.
https://173tech.com/data-salaries/
The data is useful. But data only tells you the range. It doesn’t tell you whether the person you’re about to hire sits at the top or the bottom of it, whether the role you’ve written matches what you actually need, or whether the market has moved since the data was last collected. If you’re hiring into data and are curious about hiring an agency as an alternative, we’re happy to talk.
