


A Data-Driven Approach To Ideal Customer Profiles
What is an Ideal Customer Profile?
An Ideal Customer Profile is a hypothetical description of the type of customer(s) you’d like to sell to. While they are fictional in nature they are meant to act as a guide as to which customers may have the quickest time to conversion, the highest retention rate or become more profitable customers over their lifetime. Typically they contain top-level information on the demographics of the target and the problems/issues your product may solve.
Example:
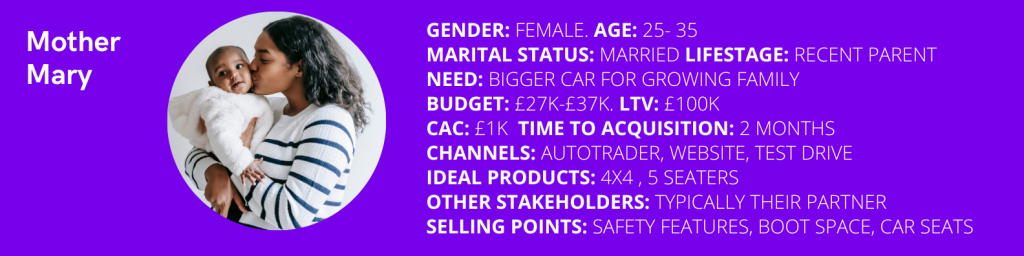
Let’s say you are a car dealership, you might have identified that a lot of people buy new cars or upgrade around the time they have their first child and create a profile around this. While a profile will typically be more detailed than this, this gives you a good overview.

ICP vs Buyer Personas vs Segments
There are a number of different ways in which to target and sort prospective and existing customers and sometimes the lines get blurred between these, so a quick recap.
ICP and Buyer Personas are often used interchangeably. For B2B companies an ICP may refer specifically to the type of company you want to sell to, where the buyer persona would refer to the people within those companies you wish to approach. Where an ICP typically refers to the people you’d like to attract, segmentation will refer to your existing customers and prospects. Although it makes complete sense to segment your existing audience based along the lines of those you’d like to attract.
How Are ICPs Traditionally Created?
Traditionally they are created manually from someone in either marketing or sales, there might be some market research which is fed into them to add more colour as to common interests and activities of the profile.
How Could Data Make A Difference?
The problem with ICPs is that they are based on market research and not actual customers. And while it’s useful for people to have an idea of who they are selling and serving, all too often they are quickly forgotten about. Data can help, not only in creating a more realistic profile, but in highlighting the real scope of the opportunity when selling to them.
By factoring in your first-party data, you no longer have to create a fictionalised picture of target customers. You have the real numbers there! By adding in elements such as the cost and time to acquisition, common marketing touchpoints and lifetime value, you will be able to influence your activity at a strategic level. If you know for example that the average time to acquisition is 3 months and you have prospects in your timeline that have been there for 6 months, then you can tell sales to de-prioritise them and work on other prospects.
Another way in which ICPs can be used is to identify potential gaps when launching a new product or targeting a new area. By investigating your first party data, you can see how many of your current customers reflect a new ICP.
Going back to our car dealership example, your firm may cater to lower income families looking for their first family car. Your key selling points may be the ease of the process, access to finance and quality of your 2nd hand models. Perhaps there is an idea that adding in more luxury cars will yield a higher profit. Data can tell you how many requests you get for these models, what proportion of your current customers could afford this and give you potential cost of acquisition for finding these customers. You may find that a current mis-alignment in your branding and messaging would make it harder to appeal to the target audience for luxury cars.
How Can This Be Applied Practically?
Stage One:
Look at your existing customers and segment them based on your ICPs. Then analysis historical data per segment to identify:
- Lifetime value
- Cost of acquisition
- Time to acquisition
- Budget range
- Common marketing touchpoints
- Shared purchases (ie what items do they have in common, what brought them into your category)
From this you can apply average numbers to your profile.
Stage Two:
Integrate propensity models to predict each of these additional insights.
A propensity model looks at the past behaviour and characteristics of your customers to make predictions about their future actions.They are typically displayed as a percentage for example: Emily has a 70% likelihood of churning. This number represents how similar Emily’s actions are to other people on your database who have already churned.
They rely on your first-party transactional data, with the more historical data you have, the more accurate they will be.These propensity models can then be applied to your CRM and marketing tools to guide your teams as to which actions to take. While an ICP acts as a guiding light on your target customers, propensity scores can give you key info on your customers on an individual basis.
ICPs can act as a guiding light for sales and marketing campaigns, but all too often they are created and forgotten about. Take a more data-driven approach to targeting and enable your team to understand not only who your ideal customers are, but what matters to them.
If you’d like to know more about tying together your customer journey through data, why not get in touch with the lovely 173tech team today?