Subscription businesses often generate strong signup numbers but struggle to turn those signups into long-term paying customers.
Signal
If large numbers of users sign up for your product but never fully engage, convert, or stick around, your acquisition is working but your activation likely is not.
Stakeholders
Founders, SaaS operators, product managers, growth leaders, marketing teams, customer success leaders, and data analysts responsible for acquisition, onboarding, or retention.
Strategy
Optimising signup quality, reducing friction in free trials, guiding users to experience value quickly through onboarding, and measuring activation metrics that predict long-term retention and revenue.
Introduction
The subscription model creates a paradox: you must acquire customers before demonstrating value, yet customers increasingly expect to experience value before paying. The tension between acquisition (getting users to start) and activation (helping them experience value) determines whether a business builds a base of retained customers or churns through signups who never discover why they should stay.
Many companies obsess over acquisition volume; driving traffic, generating leads, increasing signups—while treating activation as secondary. The result is a leaky funnel where 60–80% of signups never experience core value, trial users abandon before converting, and first-month churn erodes what looked like successful acquisition campaigns. In subscription businesses, poor activation can destroy the economics of even efficient acquisition engines.
Why These Stages Matter
Subscription businesses rely on recurring revenue, so the early customer experience has an outsized impact on lifetime value.
Early Success Predicts Long-Term Retention
Customers who experience value early retain dramatically better than those who do not.
Activated customers often retain 85–95% annually
Non-activated users may retain 20–40%
Over three years, activated users can generate 10–15x more revenue than users who churn early.
This means activation rate is often more important than acquisition volume. Doubling activation from 30% to 60% has the same impact on activated users as doubling acquisition, but without doubling acquisition spend.
Early value also creates lasting habits. Users who succeed in their first week establish workflows and outcomes that make long-term retention far more likely.

Activation Drives Growth Loops
Activated customers become advocates. They write positive reviews, provide testimonials, refer others, and participate in communities that attract new users.
Poor activation has the opposite effect. Churned users who never experienced value leave negative feedback, increase market scepticism, and force companies to rely more heavily on expensive paid acquisition.
For most subscription companies, it is often wise to prioritise activation improvements until rates reach roughly 60–70% before aggressively scaling acquisition. Many companies do the opposite: scaling acquisition while activation remains mediocre, creating expensive churn treadmills.
Expert help is only a call away. We are always happy to give advice, offer an impartial opinion and put you on the right track. Book a call with a member of our friendly team today.
Measuring Signup Quality
Basic signup metrics focus on volume, but sophisticated subscription businesses measure signup quality and its likelihood to activate.
Form Completion Rate
Form completion rate measures how many users who begin signup actually finish.
Example:
If 1,000 users reach the signup page and 600 register, completion is 60%.
Low completion rates signal friction such as: Too many form fields, confusing instructions, technical issues, trust concerns
Email-only signup forms may reach 85–90% completion, while complex multi-step forms might see 40–50%. Improving completion often involves removing fields, simplifying flows, or strengthening value messaging.
Click-to-Signup Conversion
This measures how many visitors from a source actually sign up. For axample: 1,000 ad clicks → 100 signups = 10% conversion
Typical SaaS benchmarks fall between 5–20%. Higher rates often indicate highly qualified traffic (referrals, targeted search), while lower rates suggest weak messaging or poor traffic quality.
Comparing conversion across channels reveals which sources deliver real prospects. For example, organic search converting at 25% may be far more valuable than display ads converting at 3%, even if display generates more traffic.
Attribution
Attribution determines which marketing activities deserve credit for signups.
Last-click attribution credits the final touchpoint before signup. It is simple but undervalues awareness channels.
First-click attribution credits the first interaction but ignores later influences.
Multi-touch attribution distributes credit across multiple interactions but requires more sophisticated analytics.
Many companies combine last-click tracking for day-to-day decisions with periodic multi-touch analysis to understand broader customer journeys.
Evaluating Traffic Sources
Traffic sources should be judged by the quality of customers they produce, not just signup cost.
Example:
Source A
1,000 signups at £5
20% activation, 80% retention
= 160 quality customers
Cost per quality customer: £31.25
Source B
400 signups at £10
60% activation, 90% retention
= 216 quality customers
Cost per quality customer: £18.52
Despite higher signup cost, Source B produces more valuable customers at lower effective cost.


Free Trials
Free trials allow users to experience value before committing to payment. Effective trial design balances product evaluation with demonstrating value quickly enough to convert.
Trial Activation Rate
Trial activation measures how many users actually begin using the product after signing up. Many trials see 30–50% of users never activate, they sign up but never return.
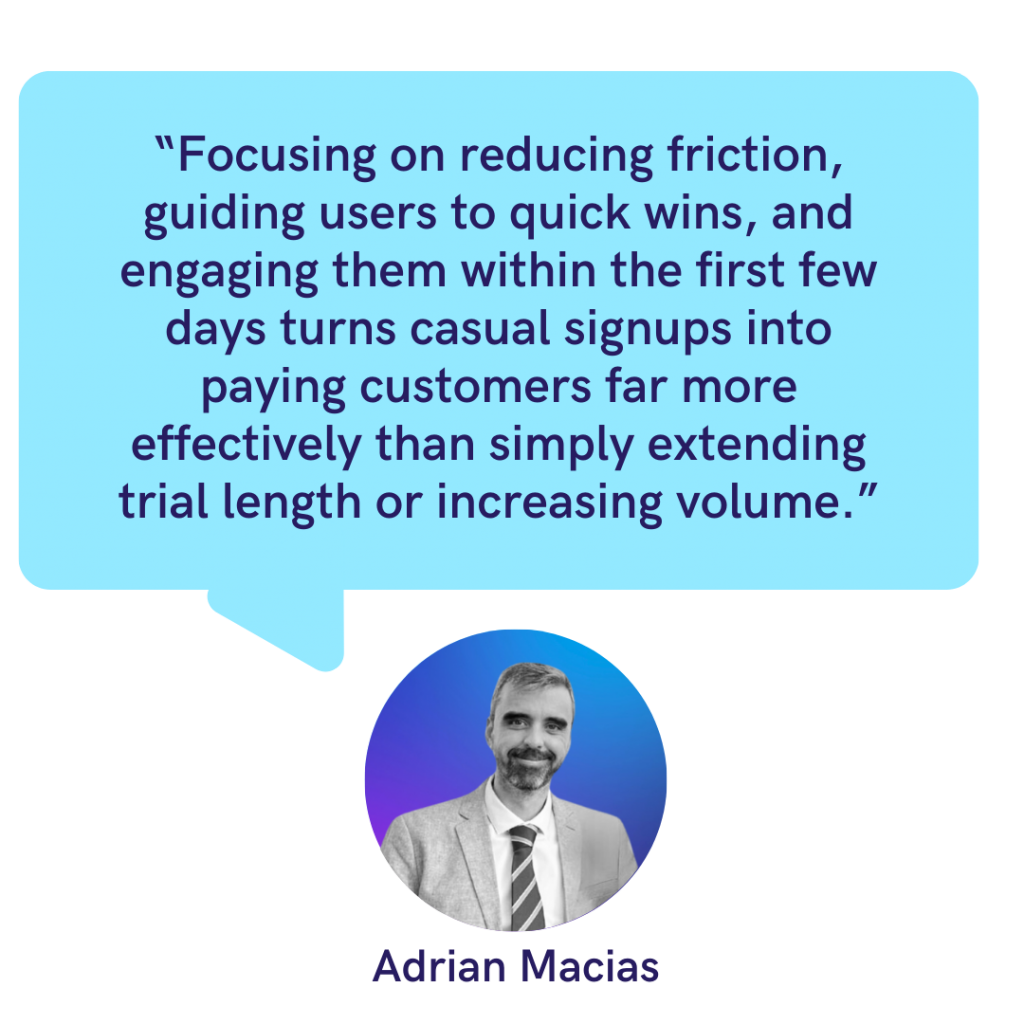
Improving activation involves: Immediate product access, clear next steps after signup, quick-start onboarding, early outreach reminding users to start.
Time-to-First-Value
This measures how long it takes users to experience meaningful value. Shorter time-to-value usually leads to higher conversions. If setup is complex or takes days, users may spend most of their trial configuring rather than experiencing benefits.
Solutions include simplifying setup, offering guided onboarding, extending trials, or demonstrating value before full configuration.
Trial-to-Paid Conversion
Trial conversion rates vary widely ~10% for complex products, but up to ~40% for simpler products and so segmentation is critical. Conversion often varies significantly by; acquisition channel, engagement level, onboarding completion, feature usage
For example, users who complete onboarding may convert at 50%, while those who do not may convert at 5% making onboarding improvement far more impactful than trying to convert disengaged users.
Trial Length
Trial duration balances evaluation time against urgency.
Short trials encourage faster decisions
Long trials allow evaluation for complex products
Optimal length depends on time-to-value and evaluation complexity. Data often shows most users who convert make the decision well before the trial expires, indicating where trial length can be optimised.
Onboarding & Activation
Onboarding bridges signup and activation, helping users experience the value promised during acquisition.
Defining the Activation Event
Activation should be defined by the early behaviour that predicts long-term retention. For example, if users who complete a certain workflow retain at 75% compared to a baseline of 40%, that workflow likely represents the true activation event. Once identified, onboarding should focus entirely on helping users reach that milestone quickly. Activation rate then measures how many users complete this key event.
Feature Adoption
Users typically need to discover 2–4 core features to experience full value. Many users only engage with obvious features and never discover more powerful capabilities. Effective onboarding actively guides users toward these high-value use cases. It is important to note however that it can be dangerous to conflate users who try every feature with automatically being of higher value.
Onboarding Completion
Low onboarding completion suggests the flow is too long, confusing, or unengaging. Improvement strategies include: Shorter onboarding flows, clear value demonstration throughout, progress indicators and milestone rewards, reminder emails for incomplete onboarding

Effective Onboarding Design
High-performing subscription businesses commonly apply several design principles.
Progressive disclosure introduces complexity gradually rather than overwhelming users upfront.
Contextual guidance provides help when users need it: tooltips, prompts, and triggered tutorials.
Gamification adds progress bars, achievements, and completion feedback to increase engagement.
Personalisation adapts onboarding based on user role or goals.
Time-based reminders re-engage users who abandon onboarding.
Human support such as chat or onboarding calls can dramatically increase activation among high-value users.
Ultimately, the most effective growth strategy for subscription businesses is not simply acquiring more users, but systematically increasing the proportion who activate and experience real value. Understanding how to do this requires overlapping behavioural and subscription data to understand lifetime value trends.
Get In Touch
Our friendly team are always on hand to answer questions, troubleshoot problems and point you in the right direction.
