


Analytics Essentials: Data Dictionary
A data dictionary captures and defines KPIs across all business functions. It outlines the business and technical definitions for each metric along with other useful information.
It is a living document that starts with your North Star metrics, followed by measurable contributing factors broken down by verticals. It evolves with your business and analytics capabilities and should always be kept up to date by all teams.
Some consider a data dictionary to be a technical documentation cataloguing objects within a database. This is the wrong way of looking at it! A data dictionary is where your data strategy starts, not where it ends.
Why You Need One
The short answer is that without it, you risk building data for data’s sake, which does not align with your business goals hence not delivering value and impact. It leads to lost confidence in data, wasted resources, and missed value and opportunities.
The key benefits of a data dictionary are:
Maximise analytics ROI. By curating KPIs that are strictly aligned with your business goals, it ensures that data delivers the right insights to the right people at the right time.
Unite all teams towards a common goal. It breaks down top growth objectives into measurable contributing factors, which can then be allocated to each business function. It creates a single source of truth, removes silos and ensures all teams drive towards the same company-level target.
Efficient workflow and processes. Easily lookup both business and technical definitions, making it easy to onboard any new team members and knowledge transfer as you grow.
Instil a data-driven culture. It serves as a common language that encourages and facilitates data-driven discussions and decision-makings across all teams.
Definition consistency and data trust. Ensure everyone is aligned on how metrics are calculated across the business and KPIs are defined consistently across all data sources and systems, removing ambiguity and doubts in data.
Help prioritise the data roadmap. As it takes a top-down approach towards measuring business goals, it helps you break down data development and provides clarity on the most important piece, which is the key to building a data roadmap that is quick to return value incrementally.
How To Get Started?
The key to a successful data strategy is to continuously deliver the most value as quickly as possible. To achieve this, you first need to understand what value means for your business given your growth ambitions.
Find Your North Star
We recommend starting with your core business goals and pinpoint your North Star metric. It is your guiding light, which will lead you to your target in the most efficient way.
North Star should not be vanity metrics. It needs to be customer-centric, leads directly to your business objectives, and has the ability to unite all teams towards a common goal.
Most companies will have 3-5 North Star metrics to reflect the complex nature of the business. For example, if you are a freemium app, then both network effect (number of active users both free and paid and their retention) and revenue (paid users) are important to your growth. If you are an eCommerce business, then you need to consider the number of new customer purchases, repeat purchases, average order value as they collectively contribute to your revenue growth and reflect customer satisfaction.
A small anecdote:
In 1999, the Mars Climate Orbiter, a 638-kilogram robotic space probe built at a cost of $125 million burned up and broke into pieces in the Martian atmosphere. Why? All because a failure to recognise and convert between metric systems!
One piece of ground software, supplied by its spacecraft builder, was producing results in the United States customary system, developed from English units (pound-force seconds). The trajectory calculation software, supplied by NASA, was expecting results in Newton-seconds. The wrong calculation brought it too close to the planet and it had to be destroyed in the atmosphere. The $125 million loss (and incalculable reputation damage) could have been easily mitigated with a standardised data dictionary and data transformation in the models!
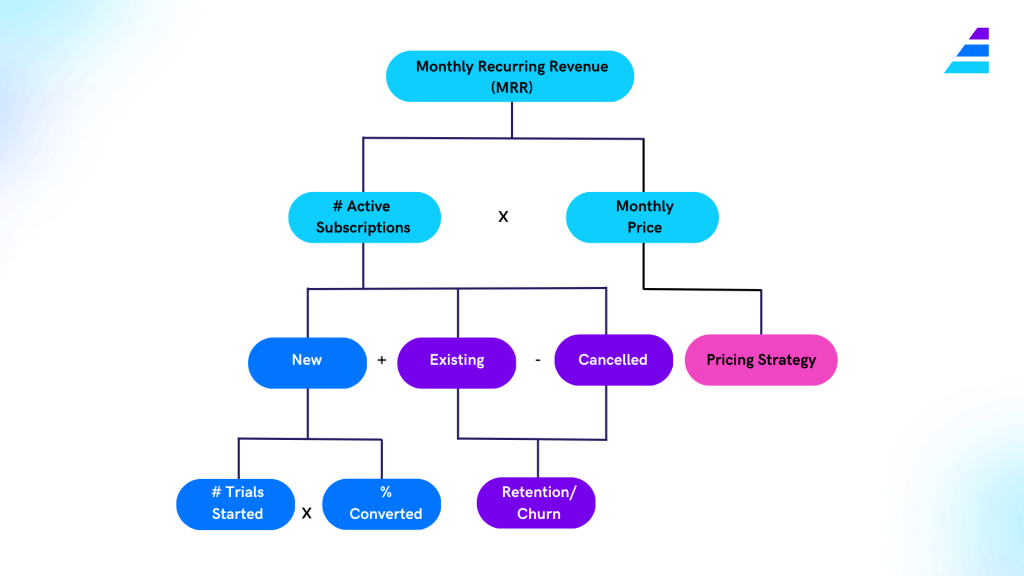
Peel The Onion
Once you find your set of North Star metrics, continue to peel the onion and breakdown each component to their contributing factors. Below is a top-level example for a subscription business with a revenue target.
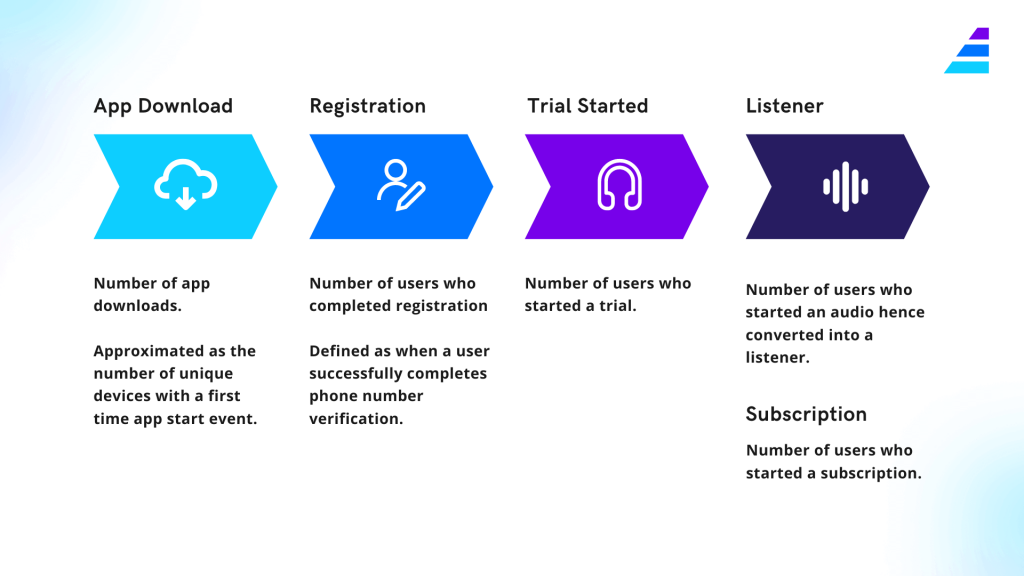
Consider Your User Journey
We talked about customer-centricity. Your KPI list needs to capture the user journey and ensure it measures how successfully you are nurturing, converting and retaining your customers. Below is a simple example mapping out the early stages of the user journey for an audio app.
Keep Expanding
Deeper And Wider Metric Coverage
Even though it is called a “data” dictionary, its primary purpose is to standardise how you measure business performances. Coming up with your own list of metrics is a business-focused process, where all teams work together to create a holistic view and keep it up to date as you grow.
For example, once you examine the high level user journey conversion, you can zoom into detailed sub flows, with a focus on your biggest drop off point. Say your biggest drop off is after download, then design and track events throughout the registration process, build hypotheses and A/B test for the optimum flow.
Perhaps you identified a retention issue and would like to step up your CRM strategy, curate metrics that measure and evaluate the impact of email sent in terms of user activities and purchases.
You can also expand to all business areas to capture logistic and warehouse efficiency, centralise all cost components, track customer sentiments and much much more.
More Technical Components
In addition to the business definitions discussed so far, as your data capability grows, we recommend expanding your data dictionary with the following fields:
- Metric Name. Standardised across all departments. There should not exist two metrics with the same name yet different definitions.
- Business Logic. Business definition of the metric.
- Category. Group metrics into business functions or product squads, e.g. user journey, on-boarding, marketing etc. It helps to structure your data dictionary.
- Data Sources. Where raw data comes from, e.g. Shopify, Facebook etc. If a metric is derived from other fields, it is useful to also mark it as ‘Enriched’.
- Raw Data Event. Event that captures the data required.
- Analytics Destination. Where the transformed data resides. Typically it is within a table in your analytics data warehouse. Be sure to document any conditions.
- Dashboards. A list of dashboards where said metric is visualised.
Conclusion
A data dictionary is a must-have in order to build successful analytics solutions that drive value and impact for the organisation. This is precisely why, at 173tech, we start every project with your data strategy and curate a standardised data dictionary. It guides development and ensures the data roadmap delivers maximum value in the shortest possible time and continues to do so going forward. If you want to learn more, please reach out to us. We are a friendly bunch and always happy to chat!