Moving Beyond
Shopify Analytics
Every eCommerce business is looking to attract loyal customers and grow their share of wallet. Most recognise that the more they know about their customers, the better they can serve them and the more profitable they will be. In fact according to Forbes: “customer-centric companies are 60% more profitable” than their competitors…need we say more?
Shopify’s built-in analytics promises to provide merchants with insights into their business, but as many store owners quickly realise, it falls short in several key areas. While its reporting tools are useful for early-stage brands, they become a growth bottleneck as businesses scale.
This article will explore:
- The key limitations of Shopify Analytics that could be hurting your business.
- Why businesses struggle with customer segmentation, attribution, and product insights using just Shopify.
- When it makes sense to invest in a custom data warehouse and what the benefits are.
A Great Foundation
For many online businesses, Shopify Analytics is an essential starting point. It provides a clean, user-friendly dashboard with insights into sales trends, returning customer rates, and top-selling products. Small and mid-sized merchants benefit from its built-in reports, which make it easy to track revenue, monitor store performance, and analyse basic customer data, all without needing third-party tools. Unlike Google Analytics, Shopify directly integrates with sales data, meaning merchants can see actual transaction revenue without complex setup.

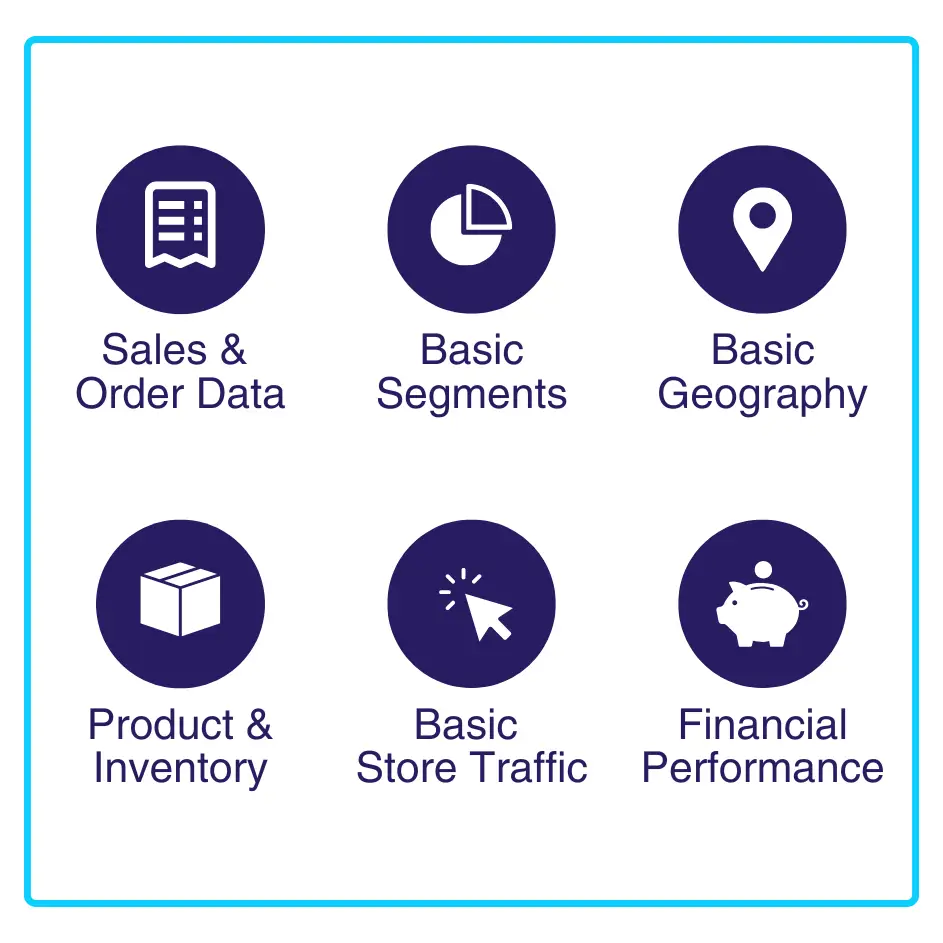
Data Shopify Analytics provides on customers:
Sales & Order Data: Total orders, average order value (AOV), and revenue.
Customer Segments: Returning vs. new customers, customer cohorts.
Geographic Data: Customer locations (but only broad country/state-level insights).
Product & Inventory Reports: What products customers are buying.
Traffic & Conversion Data: Where customers are coming from (limited attribution).
Financial Performance: including profit and loss statements, expenses, taxes, and payment methods.

What Shopify Analytics Lacks:
Age, Gender, or Income Data – Unlike Facebook Ads or Google Analytics, Shopify does not track these personal attributes.
Deep Customer Insights – Shopify lacks behavioural analytics like customer interests, purchase motivations, or risk of churn.
Limited Segmentation – You can filter customers by order history but not by behaviours, preferences, or LTV (lifetime value).
Why This Matters
Shopify Analytics gives you a good indication of what has happened, but not much more. It is difficult for business owners to optimise their offerings or more closely target their audience without deeper insights into purchase behaviour, intent, profit and an overview of the entire customer journey.
So how do people move beyond the limitations of Shopify Analytics and what are the pros and cons of different routes?
“Demographics tell me who my customers are on paper, but not what drives them. Two customers with the same age and income can have completely different needs, and Shopify doesn’t help me figure that out.”
Head of Product, Momentary Ink


Google Analytics For Marketing
The first gap that most eCommerce businesses try to fill is in web traffic.
Google Analytics (GA4) is the go-to tool for tracking where customers come from, measuring site performance, and analysing web behaviour.
Pros of Google Analytics:
Best for understanding traffic sources and marketing campaign performance.
Can integrate with Google Ads, Meta Ads, and other ad platforms.
Free to use.
Helps track website engagement metrics like bounce rates and conversion funnels.
Cons of Google Analytics:
Does not track all sales – It only tracks online store purchases, missing phone orders, subscription renewals, and in-person sales. Setting up tracking can also be a little difficult.
Data discrepancies – Shopify and GA4 often show different numbers due to tracking blockers, cookie restrictions, and different attribution models.
Not focused on LTV or retention – GA4 is great for traffic insights but weak on customer insights like repeat purchases, LTV, and retention.

Whilst Google Analytics gives you more visibility on web traffic, many eCommerce brands we speak to quickly get frustrated by the fact that it essentially creates two versions of the truth. The same metrics are defined in different ways by different tools. For example if you wanted to look at website sessions, some analytics software might include search bots as visitors and give you a higher number, while others will not. Different reporting time zones often cause a headache. At a simple level Google Analytics might be reporting using GMT and Shopify UTC, causing a difference in the numbers. Many clients tell us they have frustrations when it comes to retention where, for example they might have a 28 subscription cycle but their Shopify reports only come in a standard calendar month.
When it comes to which data sources to trust 173tech always advise that it’s about choosing which is the most accurate, as opposed to which provider might have the prettiest interface or promise all your metrics in one place. In this case Shopify is your source for anything relating to your customers and sales and Google Analytics is your source for anything relating to website conversion. It really is as simple as picking the right numbers from the right platform when you are starting with analytics.
Expert help is only a call away. We are always happy to give advice, offer an impartial opinion and put you on the right track. Book a call with a member of our friendly team today.
Plug-Ins & Point Solutions
Shopify’s built-in analytics are limited, so many businesses turn to third-party Shopify apps to fill in the gaps. There are hundreds of apps available that provide better tracking of profitability, customer lifetime value (LTV), retention, and marketing attribution.
Pros of Plug-ins:
Quick to install and use – Most tools integrate directly with Shopify with one-click installation.
Designed for eCommerce businesses – Built with Shopify stores in mind, so you get relevant metrics like AOV, LTV, CAC, and retention.
Better tracking for LTV, retention, and profitability – Many tools offer customer segmentation, churn predictions, and profit calculations that Shopify lacks.
No coding or technical expertise required – Ideal for non-technical store owners who want actionable insights without SQL or data engineering.
Some tools offer proactive recommendations – AI-driven tools like RetentionX help businesses take actionable steps to improve retention and revenue.
Cons of Plug-ins:
Data silos – Each tool tracks only a part of the picture, meaning you might need multiple apps to get a complete view.
Recurring costs add up – Most apps are subscription-based ($50–$500/month) which can become very expensive as you scale.
Limited custom reporting – These tools provide pre-built dashboards, but you may not get full flexibility to build reports based on your unique needs.
Dependent on Shopify’s data – If Shopify tracking is inaccurate, plug-ins relying on that data will inherit the same errors.
Can become overwhelming – Using too many different tools can lead to fragmented data and conflicting insights, making it harder to make informed decisions.
The main problem we see with these types of plug-ins is that they tend to be one-size-fits all and may not calculate everything in line with your businesses needs, and again the more tools you use, the more likely it is that you get different numbers from different sources.
Cost: Plug-Ins vs Custom
At low volume levels, plug-ins are very cost-effective, for example if have 1000 orders a month and use Segmentrics for your acquisition data, Lifetimely to understand your margins and RetentionX to keep hold of customers. Your monthly bill would be a total of $433. But what about when you scale? These same three tools will cost you over $2000 a month if you have scaled to 10,000 orders, and there will likely still be gaps in your data knowledge that require another tool.
Building your own data stack has a higher upfront cost, but the ongoing price to process data is much lower (think hundreds not thousands) and not only that, you own all the data, all the logic is bespoke and you can centralise everything you need.


Ruben Scott, Analytics Lead
At the point where you have 15,000 orders a month, the payback period on a data stack in less than a year and the ongoing costs represent a $20k saving. It becomes a no-brainer.
Manual Reporting In Excel & Sheets
Many businesses rely on manual data exports from Shopify into Excel or Google Sheets for analysis. This method allows full control over metrics like customer lifetime value (LTV), churn rate, repeat purchase behavior, and marketing performance, without the need for expensive third-party tools. However, while spreadsheets are familiar and flexible, they quickly become a bottleneck as a business scales.
Pros of Excel/Google Sheets:
Full Control Over Data: Businesses can create custom formulas and analyse their data however they see fit. Unlike pre-built reports from Shopify or third-party tools, spreadsheets allow for tailored insights.
No Recurring Software Costs: Excel (via Microsoft Office) has a one-time license fee, and Google Sheets is free with a Google account. This makes it cost-effective for startups and small businesses.
Combines Data From Multiple Sources: You can merge Shopify exports with data from Google Ads, Facebook Ads, CAC (Customer Acquisition Cost), inventory reports, or CRM data, providing a more comprehensive business view.
Highly Customisable Dashboards: Businesses can build pivot tables, charts, and custom reports to track key metrics without needing coding expertise.
Cons of Excel/Google Sheets:
Time-Consuming & Manual: Unlike automated analytics tools, using spreadsheets requires frequent manual updates. Every time new sales, marketing, or customer data comes in, someone has to export, clean, and input it into the sheet.
Error-Prone & Inaccurate: Research shows that 88% of spreadsheets contain errors (Source: MarketWatch). A single wrong formula or missing data entry can lead to misleading conclusions, which can be costly for decision-making.
Not Scalable: Excel struggles with large datasets. Once you exceed tens of thousands of rows, spreadsheets become slow, unresponsive, and prone to crashing. Google Sheets, while more collaborative, lags with too many formulas or data connections.
No Automation or Real-Time Insights: Unlike dedicated analytics tools, spreadsheets require constant manual intervention. If sales trends shift overnight, you will know until the next scheduled data refresh.
While Excel and Google Sheets offer affordability and flexibility, they become impractical as data complexity grows. Businesses that start with spreadsheets eventually outgrow them and transition to automated analytics tools or data warehouses to scale their insights effectively. So how can businesses move beyond plugging the gaps in their knowledge with 101 plug-ins and manually tracking everything in spreadsheets? The answer is a Data Warehouse approach…
Implementing A Data Warehouse


A data warehouse, such as BigQuery, Snowflake, or Redshift, is a powerful tool that allows businesses to centralise all their data from various sources like Shopify, ad platforms (Google Ads, Facebook Ads), email marketing tools (e.g. Klaviyo), and customer service systems (e.g. Zendesk) into one unified platform. This centralised approach ensures that all business-critical data is housed in a single location, making it easier to analyse and derive insights across the organisation.
Why Businesses Move to a Data Warehouse:
They outgrow Shopify Analytics & plug-ins: As businesses scale, they find that the out-of-the-box analytics from Shopify or basic plug-ins no longer meet their needs. Data warehouses offer more advanced functionality and flexibility to handle larger datasets and provide deeper insights.
They need a single source of truth for marketing, sales, and customer insights: Having data dispersed across multiple platforms can create confusion and lead to inconsistent or conflicting reporting. A data warehouse centralises data, ensuring all teams are working from the same source of truth, which improves decision-making and collaboration.
They want custom reporting and predictive analytics: Off-the-shelf reporting often does not cover all the specific metrics a business needs. Data warehouses allow for custom report creation, along with the ability to implement predictive analytics (e.g. forecasting sales trends or customer churn) to guide strategic decisions.

Pros of a Data Warehouse:
Combines all data sources: A data warehouse integrates data from a wide range of sources such as Shopify, Google Analytics, Facebook Ads, Klaviyo, Zendesk, and more. This ensures that all business activities are captured in one centralised place.
Automated reporting: Say goodbye to the days of manually compiling data or waiting for reports. Data warehouses can be set up to automatically generate reports in real-time, allowing businesses to make decisions faster and more accurately.
Fully customisable: The power of data warehouses lies in their flexibility. Businesses can design and build their own reports tailored to their unique needs, whether it is customer lifetime value (LTV), campaign performance, or advanced financial modelling.
Advanced insights: With the consolidated data in one place, businesses can dive deeper into their analytics, uncovering valuable insights such as customer retention trends, lifetime value predictions, churn risk, and forecasting future sales based on historical data.
Cons of a Data Warehouse:
High setup cost: Setting up a data warehouse requires a significant upfront investment. Unlike plug-ins or simple reporting solutions, creating an efficient data warehouse can be expensive, as it often requires specialised engineers or data professionals to handle the configuration and integration of various data sources.
Time to value: Modelling data is writing custom code which takes time, think weeks and not days and so integrating multiple sources and modelling a large amount of KPIs can take many months.
Ongoing maintenance: Data warehouses are not “set it and forget it” solutions. To ensure data integrity, businesses need to continuously maintain and update the system to accommodate new data sources, make adjustments as necessary, and troubleshoot any issues that arise.
Data warehouses are ideal for growing businesses that need full control over their data, have complex reporting needs, and are looking to scale, but how do you know if your eCommerce business is ready?
When Are You Ready For A Data Warehouse?
- If your annual revenue exceeds £1 million: If your business is generating £1 million or more in revenue, the inefficiencies of using basic Shopify Analytics and third-party apps begin to outweigh the costs of implementing a data stack.
- Multiple Data Sources: When you are pulling data from various platforms (Shopify, Facebook Ads, Google Ads, Klaviyo, Zendesk, etc.) managing this information manually or with limited integrations becomes increasingly difficult and prone to error.
- Complex Reporting Needs: As your business grows, you will need more sophisticated reports. Whether it is customer segmentation, lifetime value (LTV) calculations, churn prediction, or inventory forecasting, a data stack allows for more granular insights and custom reports that are not possible with Shopify Analytics.
- Scalability: If you are preparing for rapid growth, you will need a solution that can scale with your business. A data stack offers a flexible, robust infrastructure for handling large volumes of data without hitting limitations.
Conclusion
While the initial cost of implementing a data stack may seem daunting, it is a long-term investment that provides better data control, efficiency, and scalability. For businesses generating significant revenue and dealing with multiple data sources, a data stack is not just a luxury, it is a necessity for future-proofing operations, improving decision-making, and maximising growth. If you are currently relying on Shopify Analytics and are starting to feel the limitations, it may be time to invest in a data stack that will save you money and time in the long run, while giving you a powerful platform for data-driven decision-making.
