Data Pipelines:
Key Considerations, ROI & Recommended Tools
A data stack is a collection of tools and technologies that work together to collect, store, process, and analyse data across an organisation. It forms the foundation of modern data infrastructure, enabling teams to turn raw data into actionable insights.
Today, it is easier than ever before to set up a data stack, but therein lies the challenge. The wrong tools and the wrong setup will not scale and eventually become a burden. Instead of enabling faster, data-driven decision-making, a poorly designed stack creates bottlenecks, increases costs, and limits the ability to adapt as business needs evolve.
In this deep dive, we discuss the key considerations when creating a data pipeline, the tools we recommend, and how to ensure ROI from your investment.
Key Considerations
Business Use Cases
Here at 173tech, we firmly believe that the only way in which you can create value from data is a clear focus on addressing business problems, questions and blindspots. That applies from the get-go when designing a data stack. Think about your current use cases for data in terms of reporting, analysis, automated workflows etc, and also what your needs might look like in the future, including embedding AI solutions. While everyone is excited about developing AI solutions today, most use cases will rely on an integrated data pipeline. Start by solving immediate business needs, while building iteratively towards an AI future.
Our deep dive can help you to identify high ROI data initiatives.
Data Volume
Understanding how much data you are likely to process can be challenging when you start. First, consider how many data sources you intend to bring into your stack. Whilst the answer for many businesses may ultimately be ‘all of them’, we always advise starting with your core source of data then, expand.
To come up with an estimate, you should think about a good proxy metric, this is a value (or values) that give you an idea of the total number of records your analytics system will have to deal with. What constitutes a good proxy metric will depend on your type of business. Number of orders would be a good predictor for an eCommerce business; number of registrations and active users for a social network or freemium model. Try to think of what your customers are doing on your platform and how many actions (events) will be produced to arrive at a good estimate.
You should also consider the difference between storage solutions when doing your calculations. For example, a backend database will not be as efficient storing the same data as a data warehouse which can benefit from more efficient compression as well as other differences in metadata like indexes. You can sometimes find a good conversion multiplier from one system to another from the tool’s documentation, but having access to multiple examples will be more accurate.
Data volumes are only going to grow as you acquire more customers, generate more orders or activities, and integrate more sources of data. You should consider the pricing model of the tools you are choosing for your analytics stack, some will charge based on the number of records processed, some by the data volume in GB/TB. Also consider how your historical data will be counted towards the cost.

Cost
Your data volume and usage will continue to grow as your business and data capabilities expand. Cost and scalability are two of the top concerns we hear from founders and CTOs. When estimating tool costs, you need the following information ready: current number of records (total, new and updates), projected growth with existing data sources and potential new ones, and expected reporting usage today and in the future.
Each tool will have its own pricing structure, for example, tools may use subscription tiers or charge separately for compute and storage. It is useful to create a comparison table for each tool component of your data stack with desired features, estimated cost today and how it is expected to increase as you scale.
Another aspect of cost is engineering resources when it comes to development and maintenance. For example, a self-hosted option will save you on tooling cost but may require more time from more senior team members.
Having a clear data strategy and business use cases upfront will also help prioritise what data to extract and reduce your overall cost.
Existing Tech Ecosystem
Your data infrastructure is an extension of your existing tech setup. It extracts data from various sources, including your operational database, third-party tools (e.g. Salesforce, NetSuite, GA4) and marketing channels. From this point onwards, it has a set of data tools to perform modelling, reporting, analysis, data science and activation tasks. Even though your data pipeline is relatively contained from the rest of your tech ecosystem, it lives within it, and so you need to consider the wider setup.
A few key factors here are your existing cloud platform, the skillset within the team, and potential benefits staying within the same service provider, for example, better compatibility and simplified billing if you stay within the Microsoft or Amazon suite of products.

Security & Data Privacy
You might also have specific requirements for compliance and data privacy. Most tools will provide details on how they meet regulatory standards such as GDPR, HIPAA or CCPA. Some tools offer an open source and self-hosted option so you have the flexibility of applying your own security standards.
If you are designing a data solution to be used by multiple clients (e.g. a reporting feature as part of a SaaS product), you may need to consider multi-tenancy and related permission requirements.
As you dig deeper into each factor and tool component, there are additional factors and complexity. Let’s take a look at the tools we recommend in greater detail…
Expert help is only a call away. We are always happy to give advice, offer an impartial opinion and put you on the right track. Book a call with a member of our friendly team today.
Recommended Data Tools
(Last Updated 18th August 2025)
As an impartial agency, we recommend tools based on scalability, integration ease, performance, and community support. Our recommendations aim to suit a range of needs, from startups to enterprise environments, without bias toward any vendor.
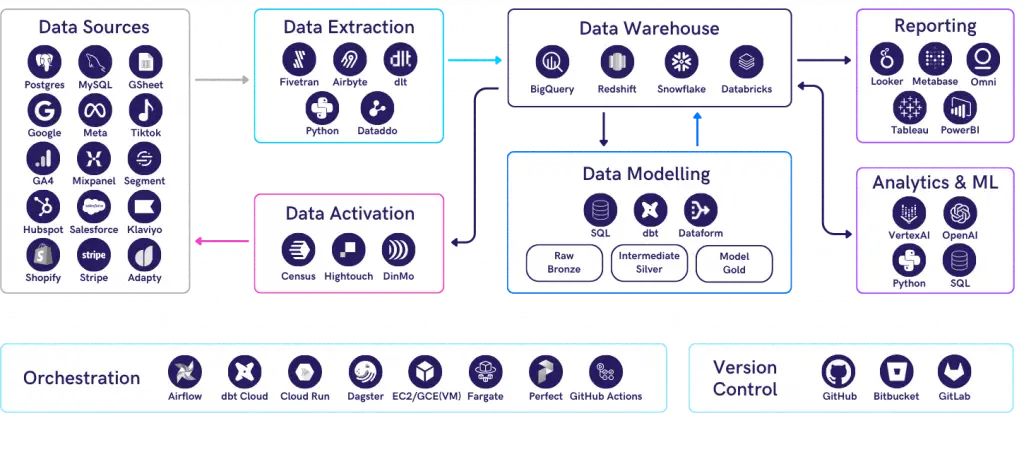

Data Sources
These are your various systems that generate and collect data. It ranges from your website, marketing channels and attribution tool, to CRM systems, backend and operational databases and more. A scaling company in its first few years will typically have around 10 data sources.
Start with your core systems; like CRM, eCommerce, and finance tools and expand as you mature, rather than trying to integrate everything at once.

Data Extraction
Your sources of data usually sit in silo, making it difficult to draw insights and conclusions across the customer journey. Ideally, all information should be connected together within a single source of truth. To do so, you first need to bring all data together. Data extraction is the process of retrieving data from multiple sources into a single destination. 173tech typically recommends using automated Extraction tools such as Fivetran rather than creating your own connector as the time/cost/effort in manually maintaining a pipeline is almost always higher than the cost of subscription.

Data Storage
This is where all your data sources are centralised. The main types are data warehouses, data lakes or lakehouses. In general, data warehouses are designed to store structured data, data lakes for structured, semi-structured and unstructured data, and lakehouses support a hybrid approach.
The main options here are BigQuery, Snowflake, Redshift, Microsoft Azure SQL and Databricks. Pick a storage solution that fits both today’s workloads and tomorrow’s growth, balancing cost efficiency with scalability. Many solutions encourage bad practices (like keeping duplicate data) at lower levels which will end up being costly once you have scaled.

Data Modelling
Once source data lands into your chosen data storage, it will go through a process of transformation based on your unique set of business logic. The resulting set of data models, organised by business concepts, is the source of truth for all your downstream analytics needs for both your data team and business users.
The most widely used tool for data modelling is dbt. It is SQL based, has a large open source community, and designed for both data engineers and analysts to contribute to the pipeline. Whilst dbt is a free tool, it is important to understand that modelling is the biggest upfront cost in any analytics project. Crunching numbers relies on code that needs to be manually created, curated and quality checked. And so the largest part of any project is in the modelling, and the largest cost in having the talent to do this.

Data Analysis
Where most business users will rely on dashboards to monitor trends and the health of the business, the analysis layer is where you deep-dive into specific topics in much greater detail. It is typically used by Data Analysts who are looking for the “why” behind the “what”.
To perform deep-dive analysis, you need a workflow to query, explore and present data. Jupyter Notebook is a good option with Python and SQL as the main programming languages. The main benefits over Excel spreadsheets are the ability to leverage a wide range of Python libraries for data processing and incorporate machine learning models; combine code, charts and text explanations in one document for both data exploration and presentation; and easy to share and rerun. If you find yourself repeating the same analysis, consider moving it to the reporting layer as an automated dashboard.

Reporting
This is the layer with the highest impact in democratising data among business users. Here modelled data is turned into charts and dashboards which make information easy to digest and investigate. One of the key purposes of reporting is to automate repeated data requests so that your data team can focus on finding deeper insights and generating more business value.
Dashboards are a great tool for everyday monitoring of key stats that will guide your business. The main tools that we recommend are Metabase, Looker (not Looker Studio), Tableau, and Power BI.
Our key piece of advice here is to let your stakeholders “play” with the tool on a demo before making a decision. No data tool is effective if the end users will struggle to use and adopt it. Choose a tool that is easy-to-use over one with fancy features or high customisation.

Data Science & AI
These are more advanced analytics with a wide range of use cases, e.g., predictions, dynamic user segmentation, matching algorithms, text analytics. Ideally, this layer should sit on top of already modelled data to leverage the same pipeline for cleaned and enriched data.
The key thing to note here is to capture the results of your data science and AI models within your data warehouse as much as possible so they can be combined with other data points and reused by other parts of the business.

Data Activation
So far, we discussed the process of extracting, loading and transforming (ELT) data from source and a number of use cases within the data pipeline. To make it a full circle, the last step is sending modelled insights back into the source systems. This process is also referred to as Reverse ETL. This enables your go-to-market (GTM) teams to leverage intelligence at scale for a wide range of purposes, e.g. target high-LTV audiences, personalised CRM strategies, automated sales workflows. There are three tools we currently recommend for this part of the data stack: Census, DinMo and Hightouch.

Orchestration
An orchestrator is a tool that is not present in all data stacks. Many setups use multiple systems that are not directly connected to each other. For example, you can have an EL tool like Fivetran extracting data and storing it in your warehouse, and a modelling system like dbt using dbt Cloud, both of which manage their own execution schedules.
An orchestrator becomes key when you require custom extraction, as it can provide a single pane of glass to trigger, monitor and debug all tasks in your pipeline, while serving as the baseline for custom code to do extraction or data science. Adopt an orchestrator once complexity grows, to centralise scheduling, monitoring, and debugging across your stack.

Conclusion
173tech would advise that it is better to have a composable stack with different elements that can be switched in and out vs an “all-in-one” system which may not provide the best overall experience in each of the different elements such as Microsoft Fabric. If you want to know the exact tools that would suit your business, why not get in touch?
Achieving ROI From Your Data Stack
Building a modern data stack is an investment. And like any investment, you no doubt are hoping you will see a return, and the faster, the better. Here are a few areas of low-hanging fruit when it comes to quickly unlocking ROI…
Automating Reporting
For most growing businesses, reporting is one of the biggest drains on time and resources. Surveys by EY suggest that data and operations teams spend as much as 2-3 days a month fulfilling reporting requests, much of it tied to management updates or investor packs.
These processes often rely heavily on manual spreadsheets, which not only consume hours of work but also introduce a high risk of errors, from broken formulas to inconsistent manual manipulation. Investor and board reporting being particularly demanding.
Automating these workflows through your data pipeline will:
Cut down hours of repetitive manual effort.
Minimise human error by replacing fragile spreadsheets with consistent, validated data.
Standardise metrics definitions so there is no confusion over “which number is right.”
Free up analysts and teams to focus on deeper insights that drive business value.

Consolidating Tools
Many companies unknowingly erode ROI by relying on multiple tools that each come with their own “black box” logic. Marketing attribution, churn, or customer lifetime value (LTV) might be calculated differently in a CRM, an analytics platform, and a finance report, leading to conflicting answers to the same question.
Not only does this inconsistency slow down decision-making, it also creates long-term dependency on vendor-defined metrics, vendors which are often expensive to maintain and difficult to scale. Each new tool adds another licence fee and another layer of complexity.
While the savings may be small when you first implement a data stack, from that day forth you own the business logic and as your data volumes scale (as they inevitably will) your ROI using a data pipeline will as well.

Closing the Response Gap
A powerful but often overlooked source of ROI is reducing the response gap, the time between when a business question is asked and when data provides the answer.
When sales or product teams wait days for data pulls, they either delay action or make decisions without facts. Both are costly: slow responses mean lost opportunities, and poor decisions can lead to wasted spend on ads, mis-priced products, or ineffective campaigns.
By building clean, well-modelled datasets accessible via self-service dashboards, teams can answer most questions instantly. Faster answers = faster execution, which directly translates into revenue protection and growth. Whilst it is difficult to put a £ number on this, make no mistake that there is a business impact in acting more quickly.

Following the Money
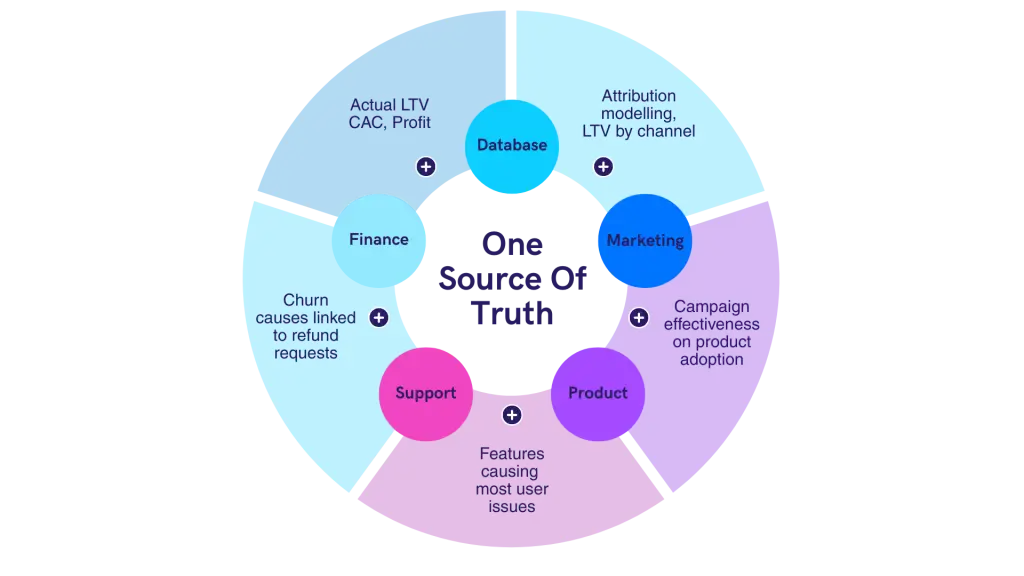
It is perhaps a movie cliche but it rings true, if you want to know the first place you should apply analytics, follow the money! Where is budget currently being allocated? Can analytics help find efficiencies in that area? Most likely the answer is yes! Too often, marketing budgets, operational costs, and customer acquisition spend are tracked in isolation, making it difficult to see the full picture. Your data pipeline acts as one source of the truth, and helps you move from siloed views to a holistic understanding. A good starting point might be to see where information from different data sources can be combined to provide better insight, for example:
Database + Marketing data = This can help you answer where to spend your advertising budget through attribution models.
Marketing + Product data = This can show you which features excite new users and what to promote.
Product + Support data = Highlights which features are causing the most user issues and might need more development.
Support + Finance data = This can tell you which complaints are linked to refund requests and cancellations.
Finance + Database data = This can show you the actual lifetime value of your individual customers, as well as their CAC (Cost of Acquisition) and profit margins.
Follow the money and you will probably find that analytics can have a big impact across the Customer lifecycle.
Conclusion
A modern data stack should never be seen as just a cost of doing business, it is an engine for efficiency, smarter decisions, and competitive advantage. The biggest returns come from eliminating manual reporting, reducing response times, consolidating logic you truly own, and following the money to understand which activities drive the most value.
173tech has a strong track record in ensuring that your data initiatives are closely linked in business value. Get in touch today if you need help in establishing a cost effective data pipeline.
